

Antiepileptic Drug of Levetiracetam Decreases Centrotemporal Spike-Associated Activation in Rolandic Epilepsy
- PMID: 30542255
- PMCID: PMC6277790
- DOI: 10.3389/fnins.2018.00796
Antiepileptic Drug of Levetiracetam Decreases Centrotemporal Spike-Associated Activation in Rolandic Epilepsy
Abstract
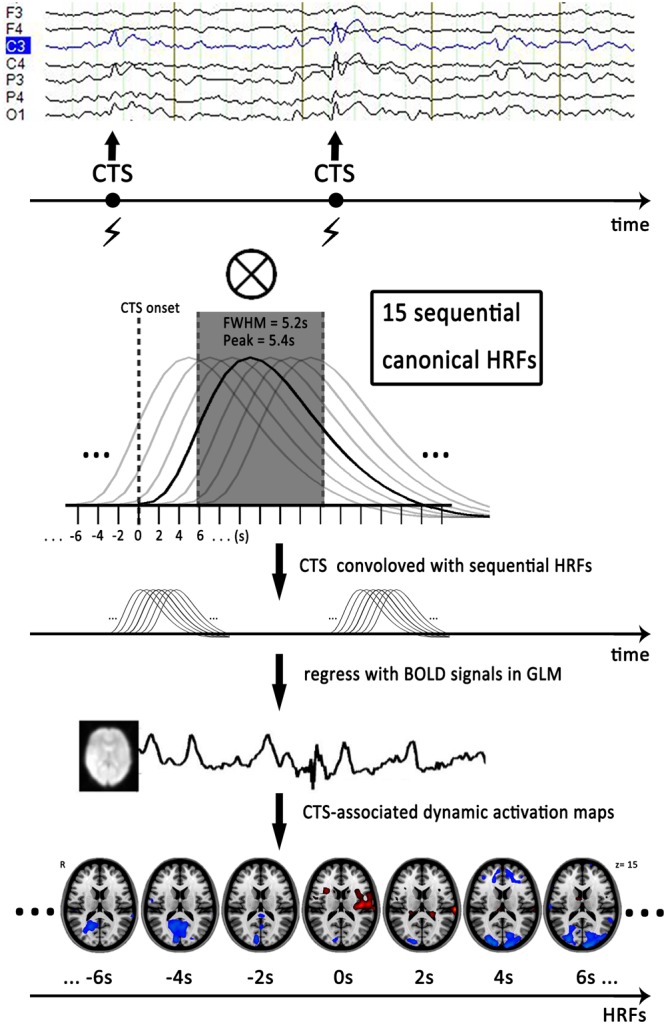
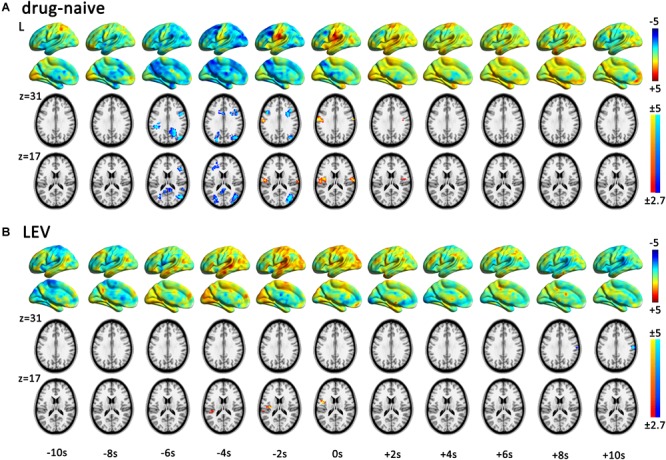
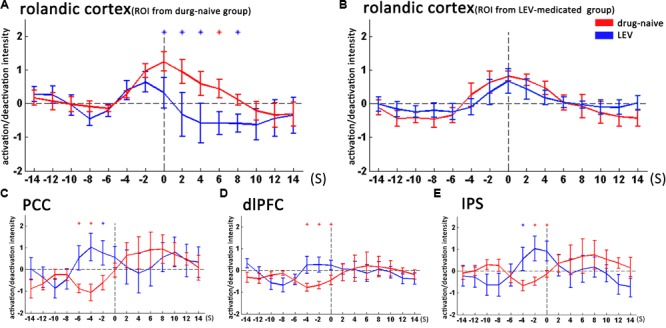
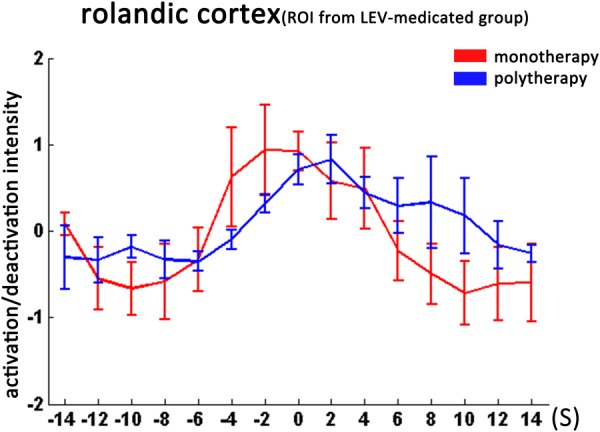
The objective was to study the modulation effects of levetiracetam on the fMRI activation/deactivation patterns associated with centrotemporal spikes (CTS) in Rolandic epilepsy. Forty patients with Rolandic epilepsy, including levetiracetam-medicated patients (n = 20) and drug-naive patients (n = 20), were studied. Single and sequential hemodynamic response functions-based EEG-fMRI analysis was performed to detect dynamic activation/deactivation associated with CTS. Comparisons of spatiotemporal features of activation/deactivation were performed between the two groups. Both the groups (CTS were detected in 12 cases of levetiracetam-medicated group, and 11 cases of drug-naive group) showed CTS-associated activation in the Rolandic cortex, whereas activation strength, time-to-peak delay, and overall activation were diminished in the levetiracetam-medicated group. Moreover, the drug-naive group showed deactivation in the regions engaged in higher cognition networks compared with the levetiracetam-medicated group. Levetiracetam inhibits CTS-associated activation intensity and alters the temporal pattern of this activation in the epileptogenic regions, and it also affects the brain deactivation related to higher cognition networks. The findings sheds a light on the pharmocological mechanism of levetiracetam therapy on Rolandic epilepsy.
Keywords: EEG-fMRI; Rolandic epilepsy; antiepileptic drugs; centrotemporal spike; sequential HRFs analysis.
Figures
Similar articles
-
Resting state signal latency assesses the propagation of intrinsic activations and estimates anti-epileptic effect of levetiracetam in Rolandic epilepsy.Brain Res Bull. 2020 Sep;162:125-131. doi: 10.1016/j.brainresbull.2020.05.016. Epub 2020 Jun 11. Brain Res Bull. 2020. PMID: 32535220
-
Real-time effects of centrotemporal spikes on cognition in rolandic epilepsy: An EEG-fMRI study.Neurology. 2016 Feb 9;86(6):544-51. doi: 10.1212/WNL.0000000000002358. Epub 2016 Jan 8. Neurology. 2016. PMID: 26747882
-
Benign Rolandic epilepsy: widespread increases in connectivity in a focal epilepsy syndrome.Epileptic Disord. 2019 Dec 1;21(6):567-578. doi: 10.1684/epd.2019.1111. Epileptic Disord. 2019. PMID: 31829304
-
Levetiracetam versus carbamazepine in treatment of rolandic epilepsy.Epilepsy Behav. 2019 May;94:1-8. doi: 10.1016/j.yebeh.2019.02.009. Epub 2019 Mar 15. Epilepsy Behav. 2019. PMID: 30884401
-
[Treatment of rolandic epilepsy].Ugeskr Laeger. 2017 Nov 27;179(48):V06170482. Ugeskr Laeger. 2017. PMID: 29208197 Review. Danish.
Cited by
-
Treatment for the Benign Childhood Epilepsy With Centrotemporal Spikes: A Monocentric Study.Front Neurol. 2021 May 6;12:670958. doi: 10.3389/fneur.2021.670958. eCollection 2021. Front Neurol. 2021. PMID: 34025572 Free PMC article.
-
The Role of EEG-fMRI in Studying Cognitive Network Alterations in Epilepsy.Front Neurol. 2019 Sep 24;10:1033. doi: 10.3389/fneur.2019.01033. eCollection 2019. Front Neurol. 2019. PMID: 31608007 Free PMC article. Review.
-
Postoperative oscillatory brain activity as an add-on prognostic marker in diffuse glioma.J Neurooncol. 2020 Mar;147(1):49-58. doi: 10.1007/s11060-019-03386-7. Epub 2020 Jan 17. J Neurooncol. 2020. PMID: 31953611 Free PMC article.
-
Atypical functional connectivity hierarchy in Rolandic epilepsy.Commun Biol. 2023 Jul 10;6(1):704. doi: 10.1038/s42003-023-05075-8. Commun Biol. 2023. PMID: 37429897 Free PMC article.
-
The Oscillatory Basis of Working Memory Function and Dysfunction in Epilepsy.Front Hum Neurosci. 2021 Jan 12;14:612024. doi: 10.3389/fnhum.2020.612024. eCollection 2020. Front Hum Neurosci. 2021. PMID: 33584224 Free PMC article. Review.
References
-
- Bakker A., Albert M. S., Krauss G., Speck C. L., Gallagher M. (2015). Response of the medial temporal lobe network in amnestic mild cognitive impairment to therapeutic intervention assessed by fMRI and memory task performance. NeuroImage Clin. 7 688–698. 10.1016/j.nicl.2015.02.009 - DOI - PMC - PubMed
LinkOut - more resources
Full Text Sources
Research Materials