. 2018 Nov 27:11:436.
doi: 10.3389/fnmol.2018.00436. eCollection 2018.

Broad and Region-Specific Impacts of the Synthetic Cannabinoid CP 55,940 in Adolescent and Adult Female Mouse Brains

Affiliations

Broad and Region-Specific Impacts of the Synthetic Cannabinoid CP 55,940 in Adolescent and Adult Female Mouse Brains

Emma Leishman et al. Front Mol Neurosci. .

Abstract

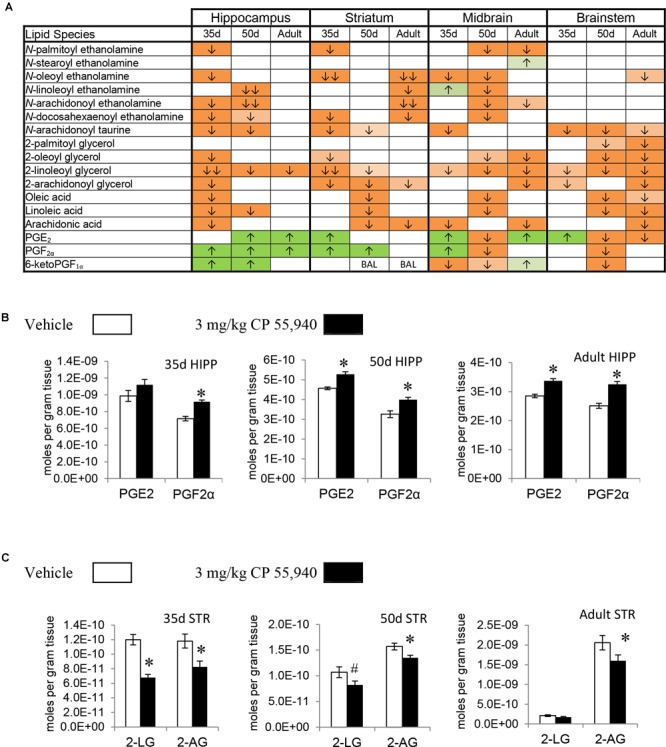
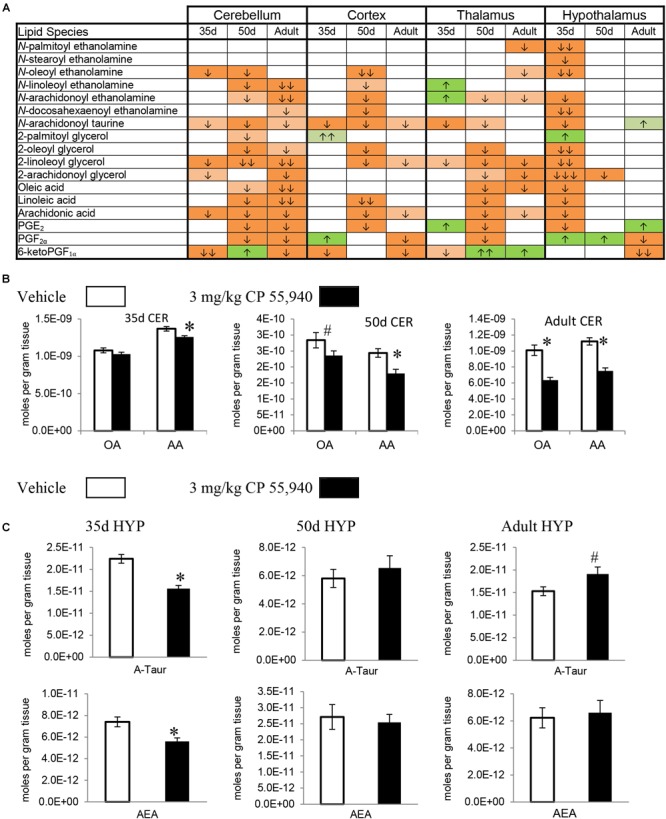
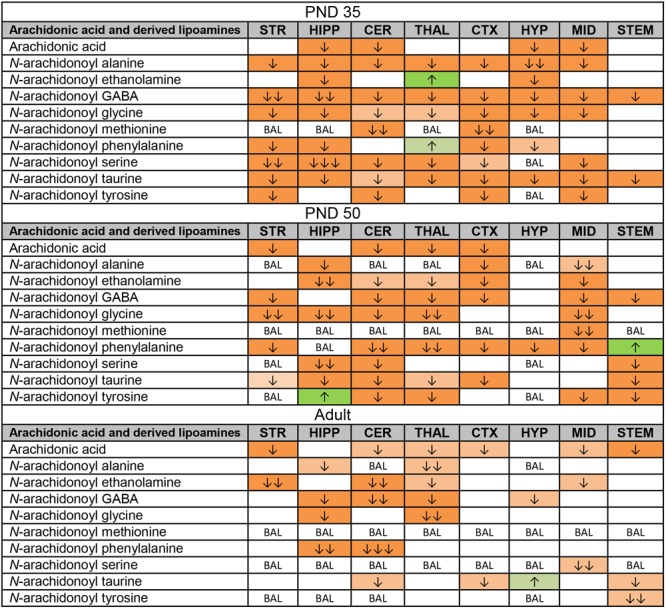
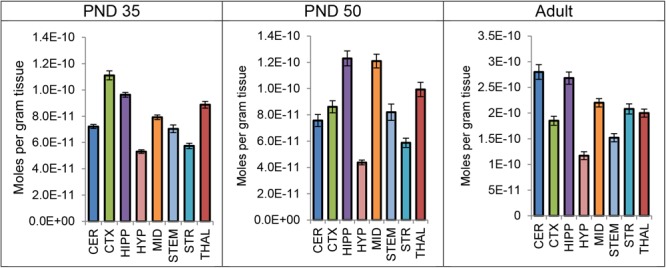
Relative to Δ9-tetrahydrocannabinol (THC), the synthetic cannabinoid CP 55,940 (CP) is significantly more potent and efficacious at cannabinoid receptors, the primary targets for endogenous cannabinoids (eCBs). eCBs belong to a large, interconnected lipidome of bioactive signaling molecules with a myriad of effects in optimal and pathological function. Recreational use of highly potent and efficacious synthetic cannabinoids is common amongst adolescents, potentially impacting brain development. Knowledge of the molecular outcomes of synthetic cannabinoid use will be important to develop more targeted therapies for synthetic cannabinoid intoxication and to prevent long-term disruption to the CNS. Here, we test the hypothesis that CP has age and region-dependent effects on the brain lipidome. Adolescent [post-natal day (PND) 35 and PND 50] and young adult female mice were given either an acute dose of CP or vehicle and brains were collected 2 h later. Eight brain regions were dissected and levels of ∼80 lipids were screened from each region using HPLC/MS/MS. CP had widespread effects on the brain lipidome in all age groups. Interestingly, more changes were observed in the PND 35 mice and more were reductions in a lipid's concentration, including region-dependent lowering of eCB levels. CP levels were highest in the cortex at PND 35, the hippocampus at PND 50, and in the cerebellum in the adult. These data provide novel insights into how high-potency, synthetic cannabinoids drive different, age-dependent, cellular signaling effects in the brain.

Keywords: CNS; endogenous cannabinoid; lipidomics; lipoamine; prostaglandin; synthetic cannabinoid.


Figures

FIGURE 1
FIGURE 1
Percentage of significant changes in the CD1 female mouse brain lipidome in post-natal day (PND) 35, PND 50, and adult mice after 2-h exposure to systemic CP 55,940 (CP). The green portions of the figure represent the percentage of lipids detected in each brain area (row) that increased with acute 3 mg/kg CP relative to vehicle in each age group (column) and the orange parts represent the percentage of lipids detected in each brain area (row) that decreased with acute 3 mg/kg CP relative to vehicle in each age group (column). The areas with the most changes are shaded in darker colors. STR, striatum; HIPP, hippocampus; CER, cerebellum; THAL, thalamus; CTX, cortex; HYP, hypothalamus; MID, midbrain; STEM, brainstem. For example, in the adult MID, there were 54 lipids detected and 13 of them changed with acute CP. Of the 13 changes, 3 of them were increases. 3 was then divided by the number of lipids detected, which in this case was 54, and multiplied by 100 to yield the percentage increased (5.55%). For the adult MID, 10 lipids decreased with acute CP out of 54 detected, giving a percentage of 18.52% for the proportion of the lipidome that decreased.
FIGURE 2
FIGURE 2
Effects of systemic 3 mg/kg CP 55,940 (CP) on levels of targeted lipids 2 h after injection in the post-natal day (PND) 35, PND 50, and adult CD1 female mouse hippocampus, striatum, midbrain, and brainstem. (A) Cells with shaded arrows indicate a change for that lipid in the CP-exposed brain area relative to the same vehicle-exposed area within each age group (35d = PND 35, 50d = PND 50). The arrow color indicates the direction of a significant result relative to control. Green colors represent increases, with darker green representing a significant increase of p < 0.05 and lighter green representing a trending increase of p < 0.10. Orange colors represent decreases in a lipid’s concentration, with darker orange indicating a significant decrease of p < 0.05 and light orange representing a trending decrease of p < 0.10. The number of arrows indicates the magnitude of the difference between CP and vehicle. One arrow indicates a magnitude difference of less than 1.5-fold and two arrows indicate a 1.5- to 1.99-fold change. BAL stands for “Below Analytical Limit,” whereas a blank cell indicates that there was no change in the lipid’s level due to CP. See Supplementary Figure 4 for a more detailed description of analysis. (B) Bar graphs showing mean levels of prostaglandin E2 (PGE2) and prostaglandin F (PGF) in the post-natal day 35 hippocampus (35d HIPP), post-natal day 50 hippocampus (50d HIPP), and adult hippocampus (adult HIPP) 2 h after a systemic vehicle injection (open bars) or a systemic 3 mg/kg CP injection (black bars). The units on the y-axis are moles of lipid per gram of tissue. Error bars are ± standard error. An asterisk () represents a difference of p < 0.05 between CP and vehicle groups. Levels of both these prostaglandins were higher in the 50d HIPP and adult HIPP (corresponding to green cells with one up arrow in panel A). In the 35d HIPP, levels of PGF increased with CP treatment but levels of PGE2 did not change. (C) Bar graphs showing mean levels of 2-linoleoyl glycerol (2-LG) and 2-arachidonoyl glycerol (2-AG) in the post-natal day 35 striatum (35d STR), post-natal day 50 striatum (50d STR), and adult striatum (adult STR) 2 h after a systemic vehicle injection (open bars) or a systemic 3 mg/kg CP injection (black bars). The units on the y-axis are moles of lipid per gram of tissue. Error bars are ± standard error. Asterisk () represents a difference of p < 0.05 between CP and vehicle groups and the pound sign (#) represents a trending difference of p < 0.10. In the 35d STR, 2-LG levels were lower in the CP-treated group (corresponding to a darker orange cell with two down arrows in panel A), whereas there was a smaller trending reduction in 2-LG in the 50d STR (corresponding to a lighter orange cell with one down arrow in panel A). No significant differences between groups in levels of 2-LG were found in the CP-treated adult STR. In all three age groups, levels of 2-AG were lower in the CP-exposed striatum (corresponding to darker orange cells with one down arrow in panel A).
FIGURE 3
FIGURE 3
Effects of systemic 3 mg/kg CP 55,940 (CP) on levels of targeted lipids 2 h after injection in the post-natal day (PND) 35, PND 50, and adult CD1 female mouse cerebellum, cortex, thalamus, and hypothalamus. (A) Cells with shaded arrows indicate a change for that lipid in the CP-exposed brain area relative to the same vehicle-exposed area within each age group (35d = PND 35, 50d = PND 50). The arrow color indicates the direction of a significant result relative to control. Green colors represent increases, with darker green representing a significant increase of p < 0.05 and lighter green representing a trending increase of p < 0.10. Orange colors represent decreases in a lipid’s concentration, with darker orange indicating a significant decrease of p < 0.05 and light orange representing a trending decrease of p < 0.10. The number of arrows indicates the magnitude of the difference between CP and vehicle. One arrow indicates a magnitude difference of less than 1.5-fold, two arrows indicate a 1.5- to 1.99-fold change, and three arrows indicate a 2- to 2.99-fold change. A blank cell indicates that there was no change in the lipid’s level due to CP. See Supplementary Figure 4 for more detailed description of analysis. (B) Bar graphs showing mean levels of oleic acid (OA) and arachidonic acid (AA) in the post-natal day 35 cerebellum (35d CER), post-natal day 50 cerebellum (50d CER), and adult cerebellum (adult CER) 2 h after a systemic vehicle injection (open bars) or a systemic 3 mg/kg CP injection (black bars). The units on the y-axis are moles of lipid per gram of tissue. Error bars are ± standard error. Asterisk () represents a difference of p < 0.05 between CP and vehicle groups and the pound sign (#) represents a trending difference of p < 0.10. In the 35d CER, there was no change in levels of OA. In the 50d CER, there was a trending decrease in OA (corresponding to a lighter orange cell with one down arrow in panel A), whereas there was an even larger decrease in OA in the adult CER (corresponding to an orange cell with two down arrows in panel A). In all three age groups, there was a reduction in AA levels in the CP-exposed cerebellum 2 h post-injection. (C) Bar graphs showing mean levels of N-arachidonoyl taurine (A-Taur) and N-arachidonoyl ethanolamine (AEA) in the post-natal day 35 hypothalamus (35d HYP), post-natal day 50 hypothalamus (50d HYP), and adult hypothalamus (adult HYP) 2 h after a systemic vehicle injection (open bars) or a systemic 3 mg/kg CP injection (black bars). The units on the y-axis are moles of lipid per gram of tissue. Error bars are ± standard error. Asterisk () represents a difference of p < 0.05 between CP and vehicle groups and the pound sign (#) represents a trending difference of p < 0.10. In the 35d HYP, acute CP lowered levels of both A-Taur and AEA (corresponding to orange cells with one down arrow in panel A). In the 50d HYP, there are no significant differences in A-Taur or AEA levels between groups. Levels of A-Taur were trending higher in the CP-exposed adult HYP (corresponding to a lighter green cell with one up arrow in panel A), but AEA levels were unaffected in this age group.
FIGURE 4
FIGURE 4
Effects of acute CP 55,940 (CP) on levels of arachidonic acid and arachidonic acid-derived lipoamines in eight regions of the post-natal day (PND) 35, PND 50, and adult female mouse brain. Effects in the PND 35 brain are shown in the top portion, the PND 50 effects are shown in the middle portion, and the effects in the adult brain are shown in the bottom portion of the figure. Cells with shaded arrows indicate a change for that lipid in the CP-exposed brain area relative to the same vehicle-exposed area within each age group. The arrow color indicates the direction of a significant result relative to control. Green colors represent increases, with darker green representing a significant increase of p < 0.05 and lighter green representing a trending increase of p < 0.10. Orange colors represent decreases in a lipid’s concentration, with darker orange indicating a significant decrease of p < 0.05 and light orange representing a trending decrease of p < 0.10. The number of arrows indicates the magnitude of the difference between CP and vehicle. One arrow indicates a magnitude difference of less than 1.5-fold, two arrows indicates a 1.5- to 1.99-fold change, and three arrows indicate a 2- to 2.99-fold change. BAL stands for “Below Analytical Limit,” whereas a blank cell indicates that there was no change in the lipid’s level due to CP. See Supplementary Figure 4 for more detailed description of analysis. Abbreviations for brain areas are: STR, striatum; HIPP, hippocampus; CER, cerebellum; THAL, thalamus; CTX, cortex; HYP, hypothalamus; MID, midbrain; STEM, brainstem.
FIGURE 5
FIGURE 5
Average level of CP 55,940 in each of eight brain regions in post-natal day (PND) 35 adolescent, PND 50 adolescent, and adult female CD1 mice 2 h after a single systemic 3 mg/kg CP 55,940 injection. Lipid levels are in moles per gram of tissue and error bars represent the standard error of the mean. CER, cerebellum; CTX, cortex; HIPP, hippocampus; HYP, hypothalamus; MID, midbrain; STEM, brainstem; STR, striatum; THAL, thalamus.

Similar articles

Cited by

References

    1. Abboussi O., Tazi A., Paizanis E., El Ganouni S. (2014). Chronic exposure to WIN55,212-2 affects more potently spatial learning and memory in adolescents than in adult rats via a negative action on dorsal hippocampal neurogenesis. Pharmacol. Biochem. Behav. 120 95–102. 10.1016/j.pbb.2014.02.014 - DOI - PubMed
    1. Alexandrescu L. (2018). ‘Ethnobotanicals’ and ‘Spice zombies’: new psychoactive substances in the mainstream media. Drugs Educ. Prev. Policy 25 356–364. 10.1080/09687637.2017.1397101 - DOI
    1. Baggelaar M. P., Janssen F. J., van Esbroeck A., den Dulk H., Allarà M., Hoogendoorn S., et al. (2013). Development of an activity-based probe and in silico design reveal highly selective inhibitors for diacylglycerol lipase-α in brain. Angew. Chem. Int. Ed. 52 12081–12085. 10.1002/anie.201306295 - DOI - PubMed
    1. BBC News (2018). ‘Devastating’ Impact of ‘Spice’ Shown in Image in Bridgend. London: BBC News.
    1. Becker J. B., McClellan M. L., Reed B. G. (2017). Sex differences, gender and addiction. J. Neurosci. Res. 95 136–147. 10.1002/jnr.23963 - DOI - PMC - PubMed