. 2018 Nov 27:12:462.
doi: 10.3389/fncel.2018.00462. eCollection 2018.

Protein Kinase C Inhibition Mediates Neuroblast Enrichment in Mechanical Brain Injuries

Affiliations

Protein Kinase C Inhibition Mediates Neuroblast Enrichment in Mechanical Brain Injuries

Francisco García-Bernal et al. Front Cell Neurosci. .

Abstract

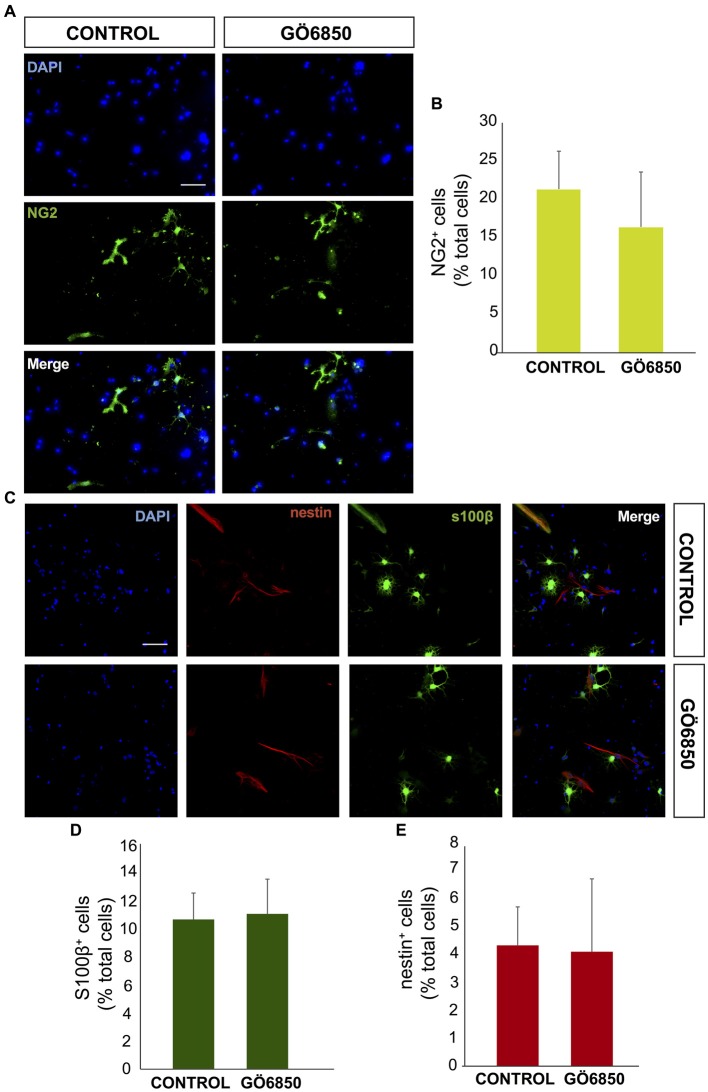
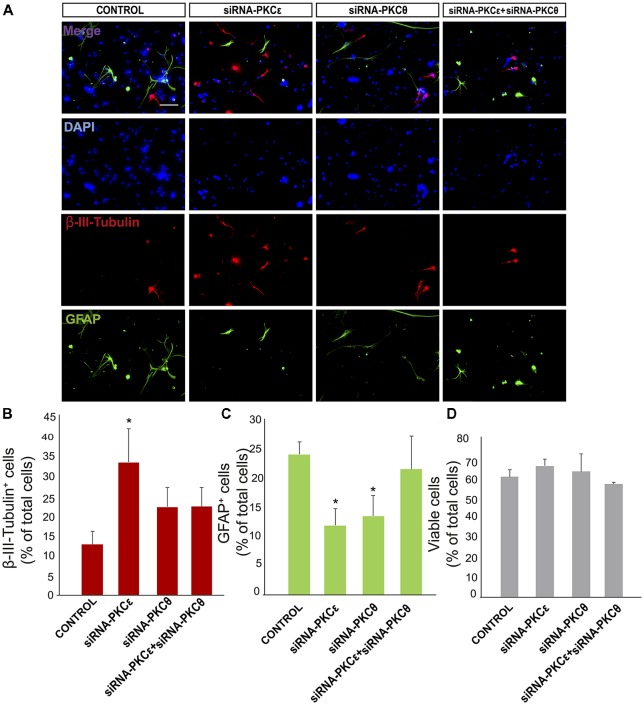
Brain injuries of different etiologies lead to irreversible neuronal loss and persisting neuronal deficits. New therapeutic strategies are emerging to compensate neuronal damage upon brain injury. Some of these strategies focus on enhancing endogenous generation of neurons from neural stem cells (NSCs) to substitute the dying neurons. However, the capacity of the injured brain to produce new neurons is limited, especially in cases of extensive injury. This reduced neurogenesis is a consequence of the effect of signaling molecules released in response to inflammation, which act on intracellular pathways, favoring gliogenesis and preventing recruitment of neuroblasts from neurogenic regions. Protein kinase C (PKC) is a family of intracellular kinases involved in several of these gliogenic signaling pathways. The aim of this study was to analyze the role of PKC isozymes in the generation of neurons from neural progenitor cells (NPCs) in vitro and in vivo in brain injuries. PKC inhibition in vitro, in cultures of NPC isolated from the subventricular zone (SVZ) of postnatal mice, leads differentiation towards a neuronal fate. This effect is not mediated by classical or atypical PKC. On the contrary, this effect is mediated by novel PKCε, which is abundantly expressed in NPC cultures under differentiation conditions. PKCε inhibition by siRNA promotes neuronal differentiation and reduces glial cell differentiation. On the contrary, inhibition of PKCθ exerts a small anti-gliogenic effect and reverts the effect of PKCε inhibition on neuronal differentiation when both siRNAs are used in combination. Interestingly, in cortical brain injuries we have found expression of almost all PKC isozymes found in vitro. Inhibition of PKC activity in this type of injuries leads to neuronal production. In conclusion, these findings show an effect of PKCε in the generation of neurons from NPC in vitro, and they highlight the role of PKC isozymes as targets to produce neurons in brain lesions.

Keywords: PKC; brain injuries; neuroblasts; neurogenesis; neuronal differentiation.


Figures

Figure 1
Figure 1
Inhibition of protein kinase c (PKC) activity promotes differentiation of neural progenitor cells (NPCs) to neuroblasts. (A) Representative fluorescence microphotographs of subventricular zone (SVZ)-derived cultured neural precursors that had been treated with either diluent (control) or the general PKC inhibitor Gö6850. Cells were grown in the absence of growth factor and allowed to differentiate for 72 h after treatment and then fixed. Neuronal cells were identified by the immunocytochemical detection of β-III-tubulin (red); glial cells were identified by the immunocytochemical detection of GFAP (green) and total nuclei were counterstained with DAPI (blue). Scale bar = 50 μm. (B) Graph represents the percentage of total cells (detected by DAPI nuclear staining) that were positive for β-III-tubulin expression. (C) Graph represents the percentage of total cells (detected by DAPI nuclear staining) that were positive for GFAP expression. (D) Graph represents the percentage of viable cells after treatment as a percentage of total cells (detected by DAPI nuclear staining). Results show a statistically significant increase in the percentage of β-III-tubulin+ cells whereas no change of GFAP+ cells is observed in the presence of the inhibitor. Data are the Means ± SEM; n = 3 independent experiments performed in triplicates. Statistical analysis: *p < 0.05 by Student’s t-test comparing with the control group.
Figure 2
Figure 2
General inhibition of PKC activity has no effect on oligodendrocytes differentiation. (A) Representative fluorescence microphotographs of SVZ-derived cultured neural precursors that had been treated with either diluent (control) or the general inhibitor of PKC Gö6850. Cells were grown in the absence of growth factor and allowed to differentiate for 72 h and then fixed. Oligodendrocytes precursors were identified by the immunocytochemical detection of NG2 (green) and total nuclei were counterstained with DAPI (blue). Scale bar = 50 μm. (B) Graph represents the percentage of total cells (detected by DAPI nuclear staining) that were positive for NG2 expression. Results show no statistically significant changes in the percentage of NG2+ cells induced by the treatment. (C) Representative confocal microphotographs of SVZ-derived cultured neural precursors that had been treated with either diluent (control) or the general inhibitor of PKC Gö6850. Astrocytes were identified by the immunocytochemical detection of s100-β (green) and total nuclei were counterstained with DAPI (blue), neural progenitor precursors were identified by the immunocytochemical detection of nestin (red). Scale bar = 50 μm. (D) Graph represents the percentage of total cells (detected by DAPI nuclear staining) that were positive for the astrocyte marker s100-β. (E) Graph represents the percentage of total cells (detected by DAPI nuclear staining) that were positive for the neural precursor marker nestin. Results show no statistically significant changes in the percentage of s100-β or nestin cells induced by the treatment. Data are the Means ± SEM; n = 3 independent experiments performed in triplicates. Statistical analysis: *p < 0.05 by Student’s t-test comparing with the control group.
Figure 3
Figure 3
Classical PKC inhibition has no effect on neuroblast or glioblast differentiation. (A) Representative fluorescence microphotographs of SVZ-derived cultured neural precursors that had been treated with either diluent (control) or the classical PKC inhibitor Gö6976. Cells were grown in the absence of growth factor and allowed to differentiate for 72 h and then fixed. Neuronal cells were identified by the immunocytochemical detection of β-III-tubulin (red); glial cells are identified by the immunocytochemical detection of GFAP (green) and total nuclei were counterstained with DAPI (blue). Scale bar = 100 μm. (B) Graph represents the percentage of total cells (detected by DAPI nuclear staining) that were positive for β-III-tubulin expression. (C) Graph represents the percentage of total cells (detected by DAPI nuclear staining) that were positive for GFAP expression. (D) Graph represents the percentage of viable cells after treatment as a percentage of total cells (detected by DAPI nuclear staining). Results show no statistically significant changes in the percentage of β-III-tubulin+ and GFAP+ cells induced by the treatment. Data are the Means ± SEM; n = 3 independent experiments performed in triplicates.
Figure 4
Figure 4
Inhibition of PKCβ and PKCα by siRNA has no effect on neuroblast or glioblast differentiation. (A) Representative fluorescence microphotographs of SVZ-derived cultured neural precursors that had been transfected with either mock (control) or the PKCα and PKCβ siRNA. Cells were transfected, grown in the absence of growth factor and allowed to differentiate for 72 h and then fixed with 4% paraformaldehyde (PFA). Neuronal cells were identified by the immunocytochemical detection of β-III-tubulin (red); glial cells are identified by the immunocytochemical detection of GFAP (green) and total nuclei were counterstained with DAPI (blue). Scale bar = 100 μm. (B) Graph represents the percentage of total cells (detected by DAPI nuclear staining) that were positive for β-III-tubulin expression. (C) Graph represents the percentage of total cells (detected by DAPI nuclear staining) that were positive for GFAP expression. (D) Graph represents the percentage of viable cells after treatment as a percentage of total cells (detected by DAPI nuclear staining). Results show no statistically significant changes in the percentage of β-III-tubulin+ and GFAP+ cells induced by the treatment. Data are the Means ± SEM; n = 3 independent experiments performed in triplicates.
Figure 5
Figure 5
PKCε induces neuronal differentiation in vitro. (A) Representative fluorescence microphotographs neurosphere-derived adhered cells transfected with PKCε siRNA, PKCθ siRNA, a combination of both siRNA or either mock (control). Neuronal cells were identified by the immunocytochemical detection of β-III-tubulin (red); glial cells are identified by the immunocytochemical detection of GFAP (green) and total nuclei were counterstained with DAPI (blue). Scale bar = 50 μm. (B) Graph represents the percentage of total cells (detected by DAPI nuclear staining) that were positive for β-III-tubulin expression after treatments with the different siRNA or mock (C) Graph represents the percentage of total cells (detected by DAPI nuclear staining) that were positive for GFAP expression after transfection with the different siRNA or mock (control). (D) Graph represents the percentage of viable cells after treatment as a percentage of total cells (detected by DAPI nuclear staining). Results show statistically significant changes in the percentage of β-III-tubulin+ and GFAP+ cells induced by the inhibition of PKCε and a decreased of GFAP+ cells after inhibition of PKCθ. Data are the Means ± SEM; n = 3 independent experiments performed in triplicates. Statistical analysis: *p < 0.05 by Student’s t-test comparing with the control group.
Figure 6
Figure 6
Local inhibition of PKC in the injured cortex increases the number of neuroblast. (A,B) Representative confocal microphotographs of the area surrounding cortical lesions in mice locally-infused with vehicle or the general PKC inhibitor Gö6850 (0.5 μM). Mechanical cortical lesions were unilaterally performed in the primary motor cortex of adult mice, and osmotic minipumps were implanted to locally deliver vehicle or Gö6850 for 14 days. All mice were intraperitoneally-injected with bromodeoxyuridine (BrdU) to label proliferating cells. In (A) scale bar represent 200 μm in low magnification images, 50 μm in medium magnification images and 20 μm in high magnification images. In (B) scale bar represents 2 mm. The dotted line indicates the limit of the lesion (L). (C) Graph shows the number of proliferating cells marked with BrdU per mm3 in the peri-lesional area of the indicated animal groups. (D) Quantification of DCX+ cells/mm3 in the peri-lesional area of the indicated animal groups. (E) Percentage of BrdU+ cells that co-expressed DCX in the peri-lesional area. Data shown are the Mean ± SEM; n = 3–6 animals per group. Statistical analysis: *p < 0.05 by Student’s t-test comparing with the control group.
Figure 7
Figure 7
Local inhibition of PKCs has no effect in the neurogenic response of the SVZ to an injury. (A) Representative fluorescence microcopy images of the SVZ of adult mice bearing unilateral cortical lesions, locally-infused with vehicle or the general PKC inhibitor Gö6850 (0.5 μM). Cortical lesions, BrdU injections and treatments were performed as described in the legend of Figure 6. Scale bar = 100μm. White arrows indicated BrdU+ cells and yellow arrows indicated double-labeled for BrdU and DCX. Dotted lines indicate lateral ventricle walls. (B) Graph represents the average ratios obtained when dividing the number of BrdU+ cells in ipsilateral SVZs by the number of BrdU+ cells in the corresponding contralateral SVZs differentiated in rostral and caudal regions. Statistical analysis: *p < 0.05 when comparing ipsilateral with contralateral SVZs in a Student’s t-test for paired samples. (C) Percentage of BrdU+ cells that co-express DCX in the rostral and caudal SVZ. Data shown are the Mean ± SEM; n = 3–6 animals per group. Statistical analysis: ANOVA and Bonferroni post-test.
Figure 8
Figure 8
Local inhibition of PKCs has no effects in the neurogenic response of the dentate gyrus (DG) to an injury. (A) Representative fluorescence microcopy images of the DG of the hippocampus of adult mice bearing unilateral cortical lesions, locally-infused with vehicle or the general PKC inhibitor Gö6850 (0.5 μM). Cortical lesions, BrdU injections and treatments were performed as described in the legend of Figure 5. Scale bar = 100 μm. White arrows indicated BrdU+ cells and yellow arrows indicated double-labeled for BrdU and DCX. Dotted lines indicate the DG border. (B) Graph represents the average ratios obtained when dividing the number of BrdU+ cells in ipsilateral DG by the number of BrdU+ cells in the corresponding contralateral DG. Statistical analysis: *p < 0.05 when comparing ipsilateral with contralateral DG in a Student’s t-test for paired samples. (C) Percentage of BrdU+ cells that co-express DCX in the DG. Data shown are the Mean ± SEM; n = 3–6 animals per group. Statistical analysis: ANOVA and Bonferroni post-test.
Figure 9
Figure 9
Local inhibition of PKCs has no effect on neural precursors cells migration from the neurogenic regions to the damage area. (A) Representative confocal microscopy images of the injured cortex of adult mice after bearing cortical lesions and locally infused with the general inhibitor of PKC Gö6850 (0.5 μM) or only vehicle for 14 days. The cortical injuries were performed to the gray matter in the primary motor cortex. The dotted line indicates the limit of the lesion (L) and the scale bar represent 100 μm. (B) Scheme of BrdU administration. Experimental procedure followed to label proliferating neural precursors with BrdU exclusively in neurogenic niches and not in the injured area: mice received BrdU injections on days 6, 5 and 4 before performing the cortical injury; then we waited three more days to allow for complete withdrawal of BrdU from the animal organism. Lesion was performed on day 0 and locally infusion of Gö6850 (0.5 μM) or only vehicle for 14 days. (C) Graph shows the number of proliferating cells marked with BrdU per mm3 in the peri-lesional area of the indicated animal groups. (D) Quantification of DCX+ cells/mm3 in the peri-lesional area of the indicated animal groups. (E) Percentage of BrdU+ cells that co-expressed DCX in the peri-lesional area (F) Percentage of DCX+ cells that co-localize with BrdU. Data shown are the Mean ± SEM; n = 3–6 animals per group. Statistical analysis: *p < 0.05 by Student’s t-test comparing with the control group.

Similar articles

Cited by

References

    1. Alvarez-Buylla A., Garcia-Verdugo J. M. (2002). Neurogenesis in adult subventricular zone. J. Neurosci. 22, 629–634. 10.1523/JNEUROSCI.22-03-00629.2002 - DOI - PMC - PubMed
    1. Arvidsson A., Collin T., Kirik D., Kokaia Z., Lindvall O. (2002). Neuronal replacement from endogenous precursors in the adult brain after stroke. Nat. Med. 8, 963–970. 10.1038/nm747 - DOI - PubMed
    1. Benarroch E. E. (2013). Microglia: multiple roles in surveillance, circuit shaping and response to injury. Neurology 81, 1079–1088. 10.1212/WNL.0b013e3182a4a577 - DOI - PubMed
    1. Blennow K., Hardy J., Zetterberg H. (2012). The neuropathology and neurobiology of traumatic brain injury. Neuron 76, 886–899. 10.1016/j.neuron.2012.11.021 - DOI - PubMed
    1. Buffo A., Rite I., Tripathi P., Lepier A., Colak D., Horn A. P., et al. . (2008). Origin and progeny of reactive gliosis: a source of multipotent cells in the injured brain. Proc. Natl. Acad. Sci. U S A 105, 3581–3586. 10.1073/pnas.0709002105 - DOI - PMC - PubMed