Review
. 2018 Nov 27:12:56.
doi: 10.3389/fnint.2018.00056. eCollection 2018.

Population Coding and Correlated Variability in Electrosensory Pathways

Affiliations
Review

Population Coding and Correlated Variability in Electrosensory Pathways

Volker Hofmann et al. Front Integr Neurosci. .

Abstract

The fact that perception and behavior depend on the simultaneous and coordinated activity of neural populations is well established. Understanding encoding through neuronal population activity is however complicated by the statistical dependencies between the activities of neurons, which can be present in terms of both their mean (signal correlations) and their response variability (noise correlations). Here, we review the state of knowledge regarding population coding and the influence of correlated variability in the electrosensory pathways of the weakly electric fish Apteronotus leptorhynchus. We summarize known population coding strategies at the peripheral level, which are largely unaffected by noise correlations. We then move on to the hindbrain, where existing data from the electrosensory lateral line lobe (ELL) shows the presence of noise correlations. We summarize the current knowledge regarding the mechanistic origins of noise correlations and known mechanisms of stimulus dependent correlation shaping in ELL. We finish by considering future directions for understanding population coding in the electrosensory pathways of weakly electric fish, highlighting the benefits of this model system for understanding the origins and impact of noise correlations on population coding.

Keywords: correlated variability; correlation shaping; electric fish; electrosensory lateral line lobe; feedback; noise correlations; population coding; stimulus encoding.


Figures

FIGURE 1
FIGURE 1
Types of neural correlations and their impact on population coding. (A) Responses (e.g., firing rate) of two neurons to repeated presentations of two different stimuli. The responses to stimulus 1 (black dots, light shading is 95% interval of the distribution) are lower than those to stimulus 2 (gray dots and dark shading) on average. The average responses (white crosses) co-vary positively (red arrow) indicating the presence of positive signal correlations. The trial-to-trial variabilities in the responses to repeated presentation of a given stimulus (e.g., scattering of black dots) co-vary negatively (blue arrow), which indicates the presence of negative noise correlations. In this example, the noise correlations aid stimulus discriminability compared to a case with independent responses (distributions would be circular). This is because noise correlations have an opposite sign compared to signal correlations, i.e., correlation structure is opposite, thereby leading to a decrease in the overlap between both distributions. Dotted line shows the best possible discrimination criterion, which allows for perfect discrimination in this case. Inset: quantification of the correlations shown in the example using cross-correlograms (CCGs, top) and spike count correlations as a function of timescale (bottom). (B) Same as (A) but with parallel correlation structure (i.e., signal and noise correlations are positive). Stimulus discriminability is impaired in this example: the overlap between distributions is increased due to the presence of noise correlations and using the discrimination criterion (dotted line) does not serve to discriminate between responses [compare to (A)]. (C) Even weak noise correlations have strong implications for coding on a population level. In absence of correlations, information in a population increases monotonically with increasing the number of neurons that are read out (solid line). With an opposite correlation structure [as in (A)], the amount of information surpasses the independent case very quickly (upper dotted line). With a parallel correlation structure [as in (B)], the growth of information is decreased and saturates. (D) Inputs to the two neurons consist of common (solid lines) as well as independent inputs (dotted lines). Signal correlations arise from inputs (independent AND shared) with similar tuning to a common signal. Noise correlations in turn arise from common inputs. Data in (C) illustrated after (Zohary et al., 1994; Averbeck et al., 2006).
FIGURE 2
FIGURE 2
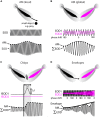
Natural electrosensory stimuli. (A) Local amplitude modulations (AM) of the EOD are caused by objects with a conductivity different to that of water (e.g., rocks or prey) during relative motion (top). The emitted EOD (middle) and the exact AM waveform will depend on the nature of the movement and the objects properties. The shown example (bottom), depicts an AM (dotted line) as it would be caused by the fish moving on a linear trajectory along a uniform conductive object (i.e., a metal sphere). Note that the EOD AM will be spatially localized and thus not spatially uniform across all receptors. (B) Global AMs are caused by interactions between the electric fields of conspecifics in proximity (top). The EODs emitted by each fish (middle, black, and magenta traces), will, due to their frequency difference, go in and out of phase repetitively (see phase shift). The periodic constructive and destructive interference between the signals will result in a compound signal (Σ EOD, bottom) with a sinusoidal AM at the frequency difference between the two EODs. This AM will be approximately spatially uniform across the fish’s skin. (C) Weakly electric fish communicate with conspecifics by emitting active modulations of their electric field called “chirps” (top). These consist of transient Gaussian-like increases in EOD frequency of one fish (middle) of a specific duration (ΔT) and frequency excursion amplitude (ΔF). As a result (bottom) the present AM (dotted line) is interrupted with a high-frequency transient (dotted line with gray shading). The resultant waveform of a chirp with a given ΔT and ΔF is very heterogeneous in Apteronotus leptorhynchus and depends on the beat phase at which the chirp is emitted. Thus, while the emitted signal of two chirps might be exactly the same, the waveform detected by the receiver will likely differ. (D) Relative motion between fish (top) will result in a change in EOD amplitude as seen from the focal fish (middle, see magenta trace, black fish is assumed as the focal fish). In the compound signal, (Σ EOD, bottom) the AM (dotted line) will, therefore, be amplitude modulated. Envelopes caused by relative motion typically have power at frequencies below 2 Hz and have been shown to be of behavioral relevance.
FIGURE 3
FIGURE 3
Anatomy of the electrosensory pathway. EOD AMs are detected by electroreceptors distributed in the fish’s skin, from where they send EAs to the electrosensory lateral line lobe (ELL) in the hindbrain (bottom left). The ELL is a cerebellum like structure with ascending (black arrows) and descending (orange arrows) projections and is organized in three parallel segments, the lateral (blue), the centro-lateral (magenta), and the centro-medial (green) segments (top left). The body surface is represented somatotopically in each segment. Moreover, pyramidal cells within all segments are arranged in a columnar organization with every column consisting of six cells (right). Three of these are on-type, as they receive direct excitatory input from EAs through basal dendrites therefore responding with an increase in firing rate to increases in EOD amplitude. The other three cells are Off-type, as they receive afferent signals via inhibitory interneurons (gr) and thus respond with a decrease in firing rate to increases in EOD amplitude. For each neuron type (i.e., On or Off), there is one superficial, one intermediate and one deep cell to be found within every ELL column. These differ in the amount of descending inputs they receive. Pyramidal neurons are the output neurons of the ELL that project to the midbrain torus semicircularis from where signals are processed and relayed to higher order brain areas to ultimately generate behavioral output. All pyramidal neurons receive descending inputs that originate from midbrain projections to the nucleus praeminentialis (nP) and projects in a somatotopically ordered fashion to the ELL (direct pathway). In addition, superficial and intermediate pyramidal neurons receive indirect descending inputs from the eminentia granularis posterior (EGP) onto their large apical dendritic arborizations in a spatially diffuse manner (indirect pathway). These inputs originate from the outputs of deep pyramidal neurons to EGP indirectly through nP. Descending inputs to ELL are excitatory via direct synapses between parallel fibers and apical dendrites and inhibitory through local interneurons in the molecular layer (not shown). EAs, electrosensory afferents; CLS, centrolateral segment; CMS, centromedial segment; EGP, eminentia granularis posterior; ELL, electrosensory lateral line lobe; gr, granule cell; LS, lateral segment; nP, nucleus praeminentialis.
FIGURE 4
FIGURE 4
Population coding of electrosensory afferents. (A) Top: Stimulus waveforms (gray shading) resulting from chirps with a fixed ΔT and ΔF emitted during different phases of the AM (EOD not shown). The waveform of the chirp on the left consists of a sharp increase of the AM, while it is a sharp decrease for the chirp on the right. The social meaning of these chirps, however, is exactly the same as established in behavioral experiments. Middle: Firing rate responses of simultaneously recorded EAs. EAs encode the waveform of the AM faithfully, which results in very heterogeneous response waveforms between the two different chirps (compare left and right). Bottom: The time varying correlations between EAs increase during the chirp event. The increase in the correlation coefficient is similar between different chirps (left vs right). (B) Quantification of responses to chirps of different phases. Responses are very heterogeneous for the different chirp phases based on firing rate (FR, triangles and dotted line) while responses are invariant based on correlations (rraw dots and solid black line). Importantly, behavioral responses were also invariant (orange dots and solid line) implying that correlations can better predict behavior than the single neuron firing rate. (C) Envelope signal (solid line on top) and time varying correlation coefficient (rraw) of two EAs. During low envelope amplitudes, the firing of EAs is heterogeneous (see raster plots in lower gray window) while during high envelope amplitudes firing is more similar between EAs (see upper gray window). The changes in correlation coefficients closely track the envelope signal (compare two solid black traces). (D) The relationship of correlation coefficients and envelope amplitude is linear and strong (for the shown example r2 = 0.76). Inset: similar results were obtained when using simultaneous and non-simultaneous recordings of EAs suggesting that noise correlations are of little relevance for signal encoding at the stage of afferents. Data in (A,B) from (Metzen et al., 2016a), in (C,D) from (Metzen et al., 2015b).
FIGURE 5
FIGURE 5
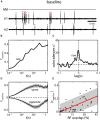
Baseline correlations in ELL pyramidal neurons. (A) ELL spiking activity of simultaneously recorded neighboring ELL neurons (n1 and n2) are typically not independent under baseline conditions (AM; no stimulus present). Many of the detected spikes (red triangles) in one neuron are nearly coincident with spikes in the other neuron. (B) Spike count correlations (rbaseline; i.e., rraw computed for spike trains recorded in absence of stimulation) as a function of time scale (t) for the neurons shown in (A). Correlations are positive in the example and increase from low to high time windows. (C) The CCG for the example in (A) shows a broad peak of coincident events near lag 0, but also for higher lags (up to ca. 50 ms) coincident events are above chance level (0). By integrating and normalizing the CCG, a correlation coefficient can be obtained quantifying the correlations at all (i.e., infinite) timescales (for the example: r = 0.42). (D) Baseline correlations for pairs of pyramidal neurons consisting of same type neurons (i.e., On–On or Off–Off) are positive on average, for opposite type neurons (On–Off) negative on average (shown are mean ± SEM). Despite their sign, the overall magnitude is the same. (E) The magnitude of baseline correlations is closely related to the amount of receptive field overlap for the ELL CLS segment. Data in (A–D) from (Hofmann and Chacron, 2017), data in (E) from (Chacron and Bastian, 2008).
FIGURE 6
FIGURE 6
Baseline correlation magnitudes are similar across the ELL segments and determined by receptive field organization. (A) Population averages of baseline correlation magnitude as a function of timescale for the three ELL segments (see labels, shown are mean ± SEM). Despite varying degrees of receptive field (RF) overlap, the average magnitude of correlations was similar in all segments. (B) Two adjacent RFs (RF1 and RF2, respectively) with a center-surround (blue–red) organization will have up to eight areas over RF overlap. The inputs from these areas will be correlated (+corr), negatively correlated (–corr) or uncorrelated (no corr). The relation of these areas (in terms of size and strength) will determine the correlations between the inputs that the two pyramidal neurons receive. (C) In a numerical simulation, varying the RF structure (i.e., relative size and strength of the RF surround) led to differences in the magnitude of baseline correlations (all values at t = 100 ms). Interestingly, physiologically plausible magnitudes [r ≈ 0.2, compare to (A)] of correlations can be found for very different RF relations (area enclosed by red dotted lines, see red markers on colorbar). (D) From the numerical simulations and previously published qualitative physiological data (Shumway, 1989), the similar magnitudes in correlations between the segments (left) can, despite the varying degree of RF center overlap (middle), be explained by a compensation through the RF surround that varies (antagonistically to RF center overlap) between the segments (right). All data from (Hofmann and Chacron, 2017). Statistical significance; n.s., not significant.
FIGURE 7
FIGURE 7
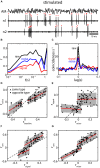
Baseline correlations predict the presence of noise correlations during stimulation. (A) Spiking activity of two neighboring pyramidal neurons (n1 and n2) during stimulation with a 0–120 Hz AM (AM, top trace). Spiking pattern encodes the AM while the average firing rate of neurons increased very little (shown neurons are the same as in Figures 5A–C). (B) Spike count correlations (r) as a function of time window (t) for raw (black), signal (red), and noise correlations (blue). Correlation structure of the shown example is parallel, i.e., both signal and noise correlations are positive. (C) CCGs for raw signal and noise correlations show prominent peaks near lag 0 extending to lags of ca. 20 ms. Note that, while the absolute peak of raw correlations is higher compared to baseline correlations (Figure 5C), the width of the peak is reduced. Correlations coefficient as determined from the CCG were: rraw = 0.27 and rnoise = 0.12. (D) Relation between the magnitude of noise (rnoise) and baseline correlations (rbaseline) for same (triangles) and opposite (dots) type pairs. Note that, for both datasets a strong positive relation was found. While the sign is preserved the magnitude of rnoise is slightly reduced compared to rbaseline as the slope of the fits (red lines) are lower than that of the identity line (dotted line). The relationship shows that based on the presence of correlations under baseline conditions, noise correlations can be expected to be present under stimulation. The gap between the two population arises as only pairs with an absolute rbaseline above 0.1 were included in the analysis (see also Chacron and Bastian, 2008). (E) The magnitudes of signal and noise correlations were not systematically dependent on each other (red lines, fit to individual datasets, slopes were not significant). However, their sign seems to be preserved in general, i.e. correlation structure in ELL is on average parallel. (F,G) Raw correlations as a function of signal (F) and noise correlations (G). In both cases, strong and significant relationships were found indicating that both components contribute to the overall correlation coefficient. However, noise correlations vary over a larger range, and the relationship was stronger suggesting that the impact of noise correlations slightly outweighs that of signal correlations. Data in (A–C) re-analyzed from Hofmann and Chacron (2017). Data in (D–G) reanalyzed from Chacron and Bastian (2008).
FIGURE 8
FIGURE 8
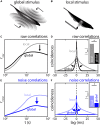
The spatial structure of stimulation shapes the magnitude and timescale of correlations between ELL pyramidal neuron activities. (A) Global stimulation resembles interaction between the electric field of conspecifics (compare Figures 2B,C). During such a stimulation, the sensory surface is stimulated uniformly with all EAs receiving a similar signal. At sufficient strength, global stimulation will activate descending inputs to ELL. (B) Local stimulation resembles electrolocation signals, i.e., interactions between the electric field and objects in the environment (compare Figure 2A). During such a stimulation, only a sub-portion of the sensory surface is stimulated. Under local stimulation, neuronal feedback is inactive (C,D) Population raw correlations during local (gray) and global (black) stimulation shown as spike count correlations as a function of timescale (C) and CCGs (D). Correlations at high timescales are strongly reduced while correlations at low timescales may be slightly increased. Inset: the correlation coefficients as obtained from the CCGs were strongly reduced under global stimulation. (E,F) Same as (C,D) but for population noise correlations. Similar, to raw-correlations, a massive reduction of noise correlations was found during global stimulation. This implies that the reduction in noise correlations is driving the reduction in raw-correlations. Statistical significance.
FIGURE 9
FIGURE 9
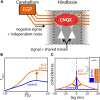
Pharmacological inactivation of descending inputs increases ELL correlations. (A) Feedforward projections of EAs to ELL pyramidal neurons are sources or shared noise generating noise correlations between neurons in close vicinity. Descending inputs from the EGP (indirect feedback) are spatially diffuse and carry independent noise. Feedback activation will thus dilute noise correlations as predicted by computational modeling leading to a decrease of noise correlation under global stimulation. The descending inputs from EGP can be pharmacologically blocked by releasing the agent CNQX in the vicinity of the apical dendrites interrupting synaptic transmission. (B,C) Population noise correlations during global stimulation and inactivation of the indirect EGP feedback through application of CNQX to the apical dendrites of ELL neurons. While noise correlations are low under global stimulation (control, blue), a large increase in noise correlations was found after feedback inactivation (EGP block, orange). In fact, noise correlations after feedback inactivation closely resembled those observed under local stimulation. Data illustrated after (Chacron and Bastian, 2008; Litwin-Kumar et al., 2012; Simmonds and Chacron, 2015). Statistical significance.

Similar articles

Cited by

References

    1. Abbott L. F., Dayan P. (1999). The effect of correlated variability on the accuracy of a population code. Neural Comput. 11 91–101. 10.1162/089976699300016827 - DOI - PubMed
    1. Allen K. M., Marsat G. (2018). Task-specific sensory coding strategies are matched to detection and discrimination performance. J. Exp. Biol. 221:jeb170563. 10.1242/jeb.170563 - DOI - PubMed
    1. Aumentado-Armstrong T., Metzen M. G., Sproule M. K. J., Chacron M. J. (2015). Electrosensory midbrain neurons display feature invariant responses to natural communication stimuli. PloS Comput. Biol. 11:e1004430. 10.1371/journal.pcbi.1004430 - DOI - PMC - PubMed
    1. Averbeck B. B., Latham P. E., Pouget A. (2006). Neural correlations, population coding and computation. Nat. Rev. Neurosci. 7 358–366. 10.1038/nrn1888 - DOI - PubMed
    1. Babineau D., Longtin A., Lewis J. E. (2006). Modeling the electric field of weakly electric fish. J. Exp. Biol. 209 3636–3651. 10.1242/jeb.02403 - DOI - PubMed

LinkOut - more resources