Network analysis of differentially expressed smoking-associated mRNAs, lncRNAs and miRNAs reveals key regulators in smoking-associated lung cancer
- PMID: 30542454
- PMCID: PMC6257755
- DOI: 10.3892/etm.2018.6891
Network analysis of differentially expressed smoking-associated mRNAs, lncRNAs and miRNAs reveals key regulators in smoking-associated lung cancer
Abstract
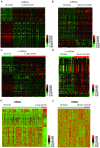
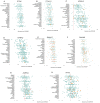
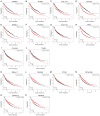
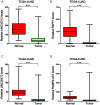
Lung cancer is the leading cause of cancer-associated mortality worldwide. Smoking is one of the most significant etiological contributors to lung cancer development. However, the molecular mechanisms underlying smoking-induced induction and progression of lung cancer have remained to be fully elucidated. Furthermore, long non-coding RNAs (lncRNAs) are increasingly recognized to have important roles in diverse biological processes. The present study focused on identifying differentially expressed mRNAs, lncRNAs and micro (mi)RNAs in smoking-associated lung cancer. Smoking-associated co-expression networks and protein-protein interaction (PPI) networks were constructed to identify hub lncRNAs and genes in smoking-associated lung cancer. Furthermore, Gene Ontology and Kyoto Encyclopedia of Genes and Genomes analyses of differentially expressed lncRNAs were performed. A total of 314 mRNAs, 24 lncRNAs and 4 miRNAs were identified to be deregulated in smoking-associated lung cancer. PPI network analysis identified 20 hub genes in smoking-associated lung cancer, including dynein axonemal heavy chain 7, dynein cytoplasmic 2 heavy chain 1, WD repeat domain 78, collagen type III α 1 chain (COL3A1), COL1A1 and COL1A2. Furthermore, co-expression network analysis indicated that relaxin family peptide receptor 1, receptor activity modifying protein 2-antisense RNA 1, long intergenic non-protein coding RNA 312 (LINC00312) and LINC00472 were key lncRNAs in smoking-associated lung cancer. A bioinformatics analysis indicated these smoking-associated lncRNAs have a role in various processes and pathways, including cell proliferation and the cyclic guanosine monophosphate cGMP)/protein kinase cGMP-dependent 1 signaling pathway. Of note, these hub genes and lncRNAs were identified to be associated with the prognosis of lung cancer patients. In conclusion, the present study provides useful information for further exploring the diagnostic and prognostic value of the potential candidate biomarkers, as well as their utility as drug targets for smoking-associated lung cancer.
Keywords: co-expression networks; long non-coding RNA; lung cancer; miRNAs; protein-protein interaction analysis; smoking.
Figures




Similar articles
-
Identification of key genes for hypertrophic cardiomyopathy using integrated network analysis of differential lncRNA and gene expression.Front Cardiovasc Med. 2022 Aug 4;9:946229. doi: 10.3389/fcvm.2022.946229. eCollection 2022. Front Cardiovasc Med. 2022. PMID: 35990977 Free PMC article.
-
Complex integrated analysis of lncRNAs-miRNAs-mRNAs in oral squamous cell carcinoma.Oral Oncol. 2017 Oct;73:1-9. doi: 10.1016/j.oraloncology.2017.07.026. Epub 2017 Jul 31. Oral Oncol. 2017. PMID: 28939059
-
Integrative Bioinformatics Analysis Reveals Potential Long Non-Coding RNA Biomarkers and Analysis of Function in Non-Smoking Females with Lung Cancer.Med Sci Monit. 2018 Aug 18;24:5771-5778. doi: 10.12659/MSM.908884. Med Sci Monit. 2018. PMID: 30120911 Free PMC article.
-
An Insight into the Increasing Role of LncRNAs in the Pathogenesis of Gliomas.Front Mol Neurosci. 2017 Feb 28;10:53. doi: 10.3389/fnmol.2017.00053. eCollection 2017. Front Mol Neurosci. 2017. PMID: 28293170 Free PMC article. Review.
-
Potential clinical application of lncRNAs in non-small cell lung cancer.Onco Targets Ther. 2018 Nov 13;11:8045-8052. doi: 10.2147/OTT.S178431. eCollection 2018. Onco Targets Ther. 2018. PMID: 30519046 Free PMC article. Review.
Cited by
-
Diagnostic role of circulating long non-coding RNA LINC00312 in patients with non-small cell lung cancer: a retrospective study.BMC Cancer. 2025 Jan 9;25(1):47. doi: 10.1186/s12885-024-13393-1. BMC Cancer. 2025. PMID: 39789501 Free PMC article.
-
Data mining-based study of collagen type III alpha 1 (COL3A1) prognostic value and immune exploration in pan-cancer.Bioengineered. 2021 Dec;12(1):3634-3646. doi: 10.1080/21655979.2021.1949838. Bioengineered. 2021. PMID: 34252356 Free PMC article.
-
Role of COL3A1 and POSTN on Pathologic Stages of Esophageal Cancer.Technol Cancer Res Treat. 2020 Jan-Dec;19:1533033820977489. doi: 10.1177/1533033820977489. Technol Cancer Res Treat. 2020. PMID: 33280513 Free PMC article.
-
Radiation increases COL1A1, COL3A1, and COL1A2 expression in breast cancer.Open Med (Wars). 2022 Feb 17;17(1):329-340. doi: 10.1515/med-2022-0436. eCollection 2022. Open Med (Wars). 2022. PMID: 35274048 Free PMC article.
-
Role of Long Noncoding RNAs in Smoking-Induced Lung Cancer: An In Silico Study.Comput Math Methods Med. 2022 Apr 30;2022:7169353. doi: 10.1155/2022/7169353. eCollection 2022. Comput Math Methods Med. 2022. PMID: 35529255 Free PMC article.
References
-
- Bhattacharjee A, Richards WG, Staunton J, Li C, Monti S, Vasa P, Ladd C, Beheshti J, Bueno R, Gillette M, et al. Classification of human lung carcinomas by mRNA expression profiling reveals distinct adenocarcinoma subclasses. Proc Natl Acad Sci USA. 2001;98:13790–13795. doi: 10.1073/pnas.191502998. - DOI - PMC - PubMed
LinkOut - more resources
Full Text Sources
Other Literature Sources
Miscellaneous
