Image analysis of the nuclear characteristics of emerin protein and the correlation with nuclear grooves and intranuclear cytoplasmic inclusions in lung adenocarcinoma
- PMID: 30542735
- PMCID: PMC6278501
- DOI: 10.3892/or.2018.6848
Image analysis of the nuclear characteristics of emerin protein and the correlation with nuclear grooves and intranuclear cytoplasmic inclusions in lung adenocarcinoma
Abstract
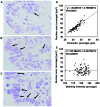
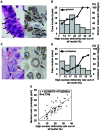
Nuclear size and shape are important components in the diagnosis of pathological specimens. However, a qualitative evaluation is typically applied rather than a quantitative evaluation technique. In the present study, we sought to evaluate the nuclear morphological characteristics of lung adenocarcinoma using whole-slide imaging (WSI) and computer-assisted image analysis (IA). We evaluated the nuclear characteristics of 106 cases of surgically resected lung adenocarcinoma according to Feulgen staining and immunohistochemistry (IHC) for the inner nuclear membrane protein emerin. According to the Feulgen reaction, although the nuclear area (size) of the carcinoma cells was correlated with the nuclear perimeter (NP) (R=0.8973), the nuclear staining intensity of carcinoma cells was not correlated with the nuclear area. Using emerin IHC, we used IA software that was able to detect both the NP and the emerin-stained nuclear membrane length (ENML) in the nucleus, and found that the more nuclei exhibited a longer ENML relative to the NP, the more nuclear grooves and intranuclear cytoplasmic inclusions were present. In addition, the nuclear area was correlated with the percentage of nuclei that had a longer ENML compared to the NP against the total nuclei (R=0.7759). Furthermore, the emerin low expression group showed an enlarged nuclear area (P=0.0264), elongated NP (P=0.0091), and lower shape factor (P=0.0486) compared with the normal emerin expression group. Our data indicated the usefulness of WSI and IA for pathological specimen analysis. In addition, this study is the first to report that the low expression of emerin in cancer cell results in an oval shape of nuclei and nuclear enlargement in clinical samples.
Figures


Comment in
-
Nuclear Cytoplasmic Inclusions in Lung Adenocarcinoma: Relevance of Immunohistochemistry.Pathol Oncol Res. 2020 Jul;26(3):1989-1990. doi: 10.1007/s12253-019-00714-0. Epub 2019 Aug 19. Pathol Oncol Res. 2020. PMID: 31428992 No abstract available.
Similar articles
-
Effect of lamins and emerin on nuclear morphology and histological architecture in lung adenocarcinoma.Pathol Res Pract. 2024 Oct;262:155557. doi: 10.1016/j.prp.2024.155557. Epub 2024 Aug 24. Pathol Res Pract. 2024. PMID: 39191195
-
Highlighting nuclear membrane staining in thyroid neoplasms with emerin: review and diagnostic utility.Diagn Cytopathol. 2013 Jun;41(6):497-504. doi: 10.1002/dc.22870. Epub 2012 May 30. Diagn Cytopathol. 2013. PMID: 22644998
-
Computer-assisted image analysis of cytological specimens clarify the correlation between nuclear size and intranuclear cytoplasmic inclusions regardless of BRAFV600E mutation in papillary thyroid carcinoma.Cytopathology. 2021 Nov;32(6):718-731. doi: 10.1111/cyt.13022. Epub 2021 Jul 9. Cytopathology. 2021. PMID: 34159645
-
The Role of Emerin in Cancer Progression and Metastasis.Int J Mol Sci. 2021 Oct 19;22(20):11289. doi: 10.3390/ijms222011289. Int J Mol Sci. 2021. PMID: 34681951 Free PMC article. Review.
-
Nuclear motors and nuclear structures containing A-type lamins and emerin: is there a functional link?Biochem Soc Trans. 2008 Dec;36(Pt 6):1384-8. doi: 10.1042/BST0361384. Biochem Soc Trans. 2008. PMID: 19021560 Review.
Cited by
-
Macrophages in Giemsa-stained cerebrospinal fluid specimens predict carcinomatous meningitis.Oncol Lett. 2020 Dec;20(6):352. doi: 10.3892/ol.2020.12217. Epub 2020 Oct 11. Oncol Lett. 2020. PMID: 33123263 Free PMC article.
-
Extreme wrinkling of the nuclear lamina is a morphological marker of cancer.NPJ Precis Oncol. 2024 Dec 2;8(1):276. doi: 10.1038/s41698-024-00775-8. NPJ Precis Oncol. 2024. PMID: 39623008 Free PMC article.
-
A brief history of the Feulgen reaction.Histochem Cell Biol. 2024 Jul;162(1-2):3-12. doi: 10.1007/s00418-024-02279-9. Epub 2024 Apr 12. Histochem Cell Biol. 2024. PMID: 38609528 Free PMC article. Review.
-
Nuclear morphometry and chromatin texture changes in hepatocellular carcinoma samples may predict outcomes of liver transplanted patients.BMC Gastroenterol. 2022 Apr 15;22(1):189. doi: 10.1186/s12876-022-02262-5. BMC Gastroenterol. 2022. PMID: 35428184 Free PMC article.
-
Imaging haemopoietic stem cells and microenvironment dynamics through transplantation.Lancet Haematol. 2020 Mar;7(3):e259-e269. doi: 10.1016/S2352-3026(20)30003-X. Lancet Haematol. 2020. PMID: 32109406 Free PMC article. Review.
References
-
- Stern E, Rosenthal DL, McLatchie C, White BS, Castleman KR. An expanded cervical cell classification system validated by automated measurements. Anal Quant Cytol. 1982;4:110–114. - PubMed
-
- Rosenthal DL, McLatchie C, Stern E, White BS, Castleman KR. Endocervical columnar cell atypia coincident with cervical neoplasia characterized by digital image analysis. Acta Cytol. 1982;26:115–120. - PubMed
Publication types
MeSH terms
Substances
LinkOut - more resources
Full Text Sources
Medical
Molecular Biology Databases
Miscellaneous

