Review
. 2019 Jan;16(1):36-51.
doi: 10.1007/s13311-018-00697-x.

Tractography for Surgical Neuro-Oncology Planning: Towards a Gold Standard

Affiliations
Review

Tractography for Surgical Neuro-Oncology Planning: Towards a Gold Standard

Sandip S Panesar et al. Neurotherapeutics. 2019 Jan.

Abstract

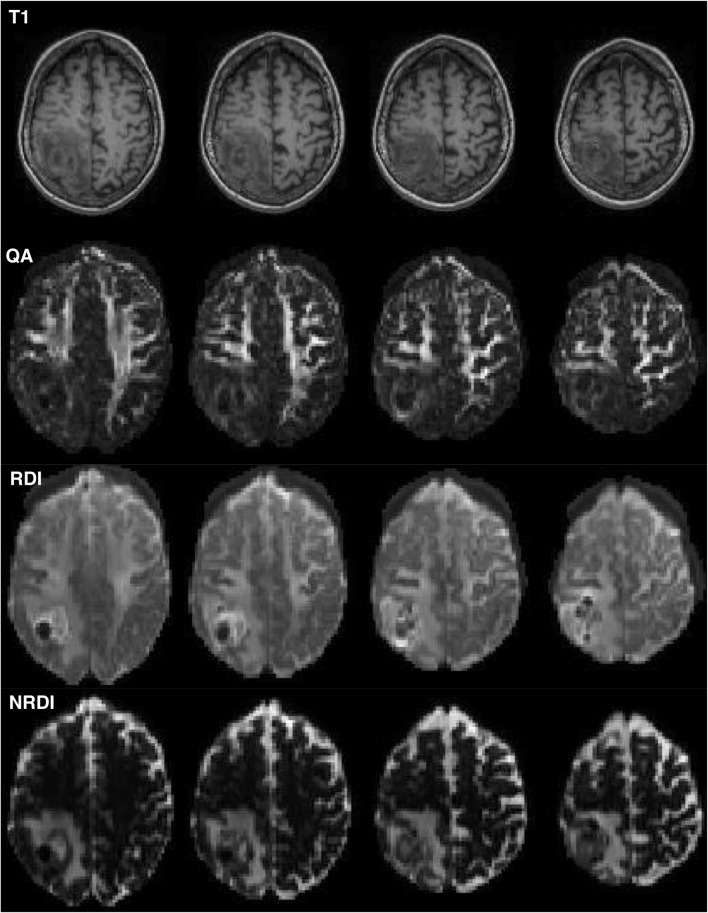
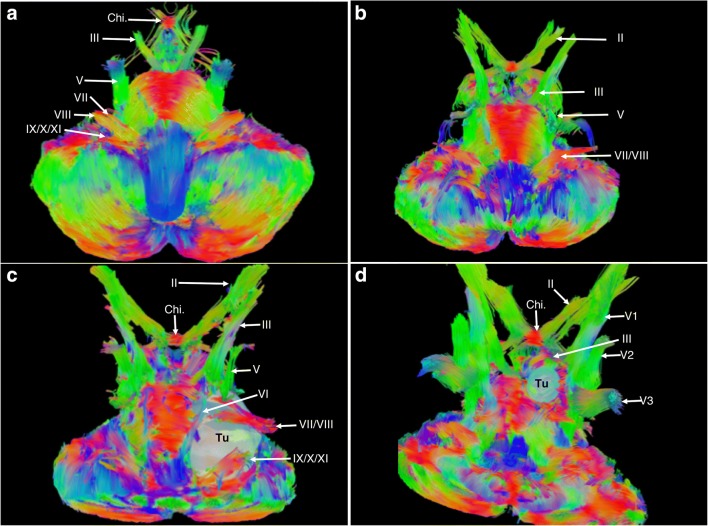
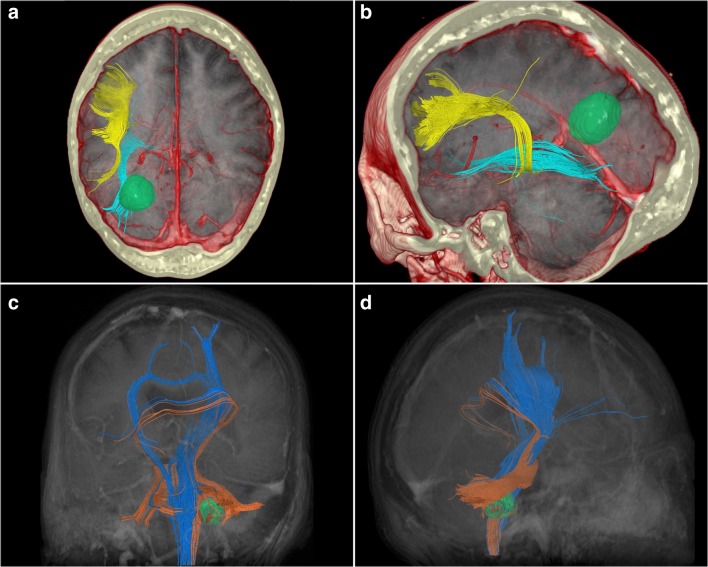
Magnetic resonance imaging tractography permits in vivo visualization of white matter structures. Aside from its academic value, tractography has been proven particularly useful to neurosurgeons for preoperative planning. Preoperative tractography permits both qualitative and quantitative analyses of tumor effects upon surrounding white matter, allowing the surgeon to specifically tailor their operative approach. Despite its benefits, there is controversy pertaining to methodology, implementation, and interpretation of results in this context. High-definition fiber tractography (HDFT) is one of several non-tensor tractography approaches permitting visualization of crossing white matter trajectories at high resolutions, dispensing with the well-known shortcomings of diffusion tensor imaging (DTI) tractography. In this article, we provide an overview of the advantages of HDFT in a neurosurgical context, derived from our considerable experience implementing the technique for academic and clinical purposes. We highlight nuances of qualitative and quantitative approaches to using HDFT for brain tumor surgery planning, and integration of tractography with complementary operative adjuncts, and consider areas requiring further research.

Keywords: Tractography; brain tumors; neuro-oncology; neurosurgical planning; white matter anatomy.


Figures

Fig. 1
Fig. 1
A 66-year-old male was incidentally found to have a left-sided parietal mass following a motor vehicle accident. It was diagnosed as a low-grade glioma and treated expectantly with repeat MRI scans. Twelve years following the diagnosis, he presented with right-sided upper and lower extremity paresthesias and gait instability. It was subsequently biopsied to reveal pathology consistent with anaplastic astrocytoma, World Health Organization (WHO) grade III (IDH mutation, MGMT methylation, TP53 mutation). He subsequently underwent awake craniotomy with tumor resection under image guidance, and awake mapping of the cortex. Postoperative recovery was unremarkable, and the patient was discharged with plans for adjuvant chemotherapy and radiation treatment. (a) A preoperative sagittal T1-weighted MRI image demonstrating the parietal lesion on the left. (b) A preoperative infero-superior axial T2-weighted MRI image demonstrating the parietal lesion, located adjacent to the sagittal fissure. (c) A sagittal image demonstrating preoperatively obtained tractography. The tumor is visible (pink), as are the tracts surrounding it. It is apparent that the tumor has invaded the superior longitudinal fasciculus (purple), which lies atop the arcuate fasciculus (green). Immediately anterior to the tumor is the corticospinal tract (orange). Posterior and inferior to the tumor is the posterior aspect of the middle longitudinal fasciculus (white). Inferior to the tumor is the inferior fronto-occipital fasciculus (red). Behind these tracts lies the cingulum (blue), a para-sagittally oriented tract. (d) A superior-aspect axial image demonstrating preoperatively obtained tractography. The tumor is visible (pink), and it is apparent that the tumor has infiltrated a large part of the left posterior cingulum (blue). In close proximity to the tumor are the corticospinal tract (orange) lying anterolaterally, the superior longitudinal fasciculus (purple) running parallel to the tumors lateral margin, and the middle longitudinal fasciculus (white) running inferiorly to the tumors inferior margins. Other visible tracts are the arcuate fasciculus (green) and the inferior fronto-occipital fasciculus (red). If the tracts are compared with the contralateral (right) hemisphere, the effects of displacement and infiltration by the tumor are apparent. (e) A sagittal image demonstrating postoperatively obtained tractography. The tumor has been removed. Apparent is that the corticospinal fibers (orange) were previously disrupted by the tumor, as a larger posterior portion is visible following removal, which were not present on the preoperative scan. A portion of the superior longitudinal fasciculus (SLF) which had been infiltrated by tumor has been sacrificed, leaving a thinned-appearing bundle. Otherwise, the other tracts have been largely unaffected from this aspect. (f) A superior-aspect axial image demonstrating postoperatively obtained tractography. Following tumor removal, the posterior portion of the left cingulum (blue) has been sacrificed due to tumor infiltration. A larger-appearing left-sided corticospinal tract (orange) and thinner-appearing superior longitudinal fasciculus (purple) are apparent due to displacement and infiltration effects, respectively. The other tracts remain largely unaffected by the procedure
Fig. 2
Fig. 2
All images are taken from the case described in Fig. 1. Tracts have been colored according to an index with darker blue representing lower QA values and white representing high QA values. (a) A superior-aspect axial view image demonstrating the left and right cingulum bundles preoperatively. Apparent is the infiltration of the left cingulum by the parietal tumor (pink). (b) A superior-aspect axial view image demonstrating the left and right cingulum bundles postoperatively. The posterior aspect of the left cingulum has been sacrificed due to tumor infiltration. (c) A left-sided sagittal view demonstrating the left-sided middle longitudinal fasciculus preoperatively. The superior aspect of the fascicle has been infiltrated by the inferior growth of the tumor. (d) A left-sided sagittal view demonstrating the left-sided middle longitudinal fasciculus postoperatively. Apparent is the very slight loss of fibers from the superior margin of the fascicle, sacrificed due to tumor invasion. (e) A left-sided sagittal view demonstrating the left-sided superior longitudinal fasciculus preoperatively. The medial boundary of the fascicle abuts the lateral aspect of tumor growth, and these fibers have been infiltrated. (f) A left-sided sagittal view demonstrating the left-sided superior longitudinal fasciculus postoperatively. Medial fibers have been sacrificed due to tumor removal, revealing an overall thinning of the bundle
Fig. 3
Fig. 3
A 26-year-old male presented to the emergency department following new-onset, intractable, generalized, tonic-clonic seizures. A large, 7-cm mass was found within the left sensorimotor area. He underwent awake craniotomy with electrical stimulation and microsurgical resection of the tumor. Subtotal resection was achieved due to the tumors’ proximity to the motor strip. The postoperative period was otherwise unremarkable, and he was discharged for follow-up. Surgical pathology revealed a WHO grade II glioma with p53, IDH1, and MGMT mutations. (a) Anteroposterior view of a coronal T1 slice demonstrating the tumor (Tu) within the left hemisphere, abutting the sensorimotor area. (b) Anteroposterior view of the red-green-blue (RGB) SDF color map. Green areas indicate anteroposterior fiber orientation; blue areas indicate superoinferior fiber orientation; red areas indicate horizontal fiber orientation. Tumor is indicated by Tu. On the right, the arcuate (R AF) and cingulum (R Cing.) have been indicated, the arcuate lateral to the corona radiata and the cingulum medial to it, and above the corpus callosum. On the left, the arcuate (L AF) has been displaced laterally and ventrally by the mass, whereas the cingulum (L Cing.) has been displaced medially and ventrally (i.e., towards the contralateral hemisphere). (c) Anteroposterior view of the RGB SDF color map. Green areas indicate anteroposterior fiber orientation; blue areas indicate superoinferior fiber orientation; red areas indicate horizontal fiber orientation. Tumor is indicated by Tu. Fiber tracts have been overlaid. From this image, the right arcuate (R AF) and cingulum (R Cing.) are demonstrated relative to the contralateral arcuate (L AF) and cingulum (L Cing.) which have been displaced. The left arcuate has been displaced laterally and ventrally, whereas the anterior fibers of the cingulum have been displaced medially and ventrally and are curving underneath the inferior aspect of the tumor as they travel forward. (d) Superoinferior view of the RGB SDF color map. Green areas indicate anteroposterior fiber orientation; blue areas indicate superoinferior fiber orientation; red areas indicate horizontal fiber orientation. Tumor is indicated by Tu. Fiber tracts have been overlaid. From this aspect, the displacement of the left arcuate (L AF) is apparent, as is the highly deviated trajectory of the left cingulum (L Cing.), which curves around the anterior aspect of the tumor. The right cingulum (R Cing.) has been mildly displaced by mass effect, whereas the right arcuate (R AF) is largely intact and nondeviated. (e) Superoinferior view of the RGB SDF color map. Green areas indicate anteroposterior fiber orientation; blue areas indicate superoinferior fiber orientation; red areas indicate horizontal fiber orientation. Tumor is indicated by Tu. The course of the corticospinal fiber tracts is indicated, as it passes through the internal capsule. At this level, the left corticospinal tract (L CST) is severely posteriorly displaced, by the tumor, relative to its contralateral counterpart (R CST). (f) Superoinferior view of the RGB SDF color map. Green areas indicate anteroposterior fiber orientation; blue areas indicate superoinferior fiber orientation; red areas indicate horizontal fiber orientation. Tumor is indicated by Tu. Fiber tracts have been overlaid. Here, the amount of displacement of the left corticospinal (L CST) tract versus the right (R CST) is readily apparent
Fig. 4
Fig. 4
A 36-year-old male presented to the outpatient clinic with a history of intermittent seizures and conductive aphasia with intact language comprehension. Investigations revealed a 4-cm lesion in the left inferior frontal lobe in the traditional Broca’s area. He underwent craniotomy and subtotal tumor resection under microscopic guidance. Surgical pathology revealed a World Health Organization Grade II astrocytoma with 9P deletion, IDH1 mutation, and MGMT methylation. His postoperative recovery was unremarkable, and he was discharged for routine follow-up. (a) A preoperative axial FLAIR sequence image demonstrating the lesion in the left inferior frontal region. (b) A preoperative coronal gadolinium-enhanced T1-weighted image demonstrating the tumor in the left inferior frontal region. (c) A preoperative oblique-sagittal view of the tumor (blue) and surrounding tracts. The inferior fibers arcuate fasciculus (AF) in the frontal lobe have been separated from the superior fibers which are intermingled with the fibers of the superior longitudinal fasciculus (green), lying atop the arcuate. (d) A postoperative sagittal view of the left hemisphere following tumor removal. Apparent is a more robust collection of arcuate fibers which had been disrupted by the tumor (compare with (c)). (e) A preoperative coronal view demonstrating specifically the bilateral frontal aslant tracts (yellow). On the left, the tumor (blue) is displacing the middle portion of the frontal aslant tract, giving it a more curved trajectory versus its right-sided counterpart. (f) A postoperative oblique view demonstrating the resection cavity of the tumor and its relation to the frontal aslant tract (yellow). The very close proximity of the tract to the tumor bed is apparent
Fig. 5
Fig. 5
The use of alternative indices derived from HDFT scans. On the top row are standard T1-weighted axial slices from a patient with a tumor in the right occipital lobe. Underneath this row are the corresponding slices taken from a QA map. Apparent are the bright areas of higher QA, which correspond to subcortical white matter. Notably in the right occipital lobe, there is an area of very low QA with a loss of white matter definition. The row below this demonstrates the RDI map corresponding to the same slices as the upper rows. Notably, peritumoral white matter definition is present and superior to the QA map, indicating that tracts may still be passing very close to the tumor, which is not apparent on the QA map. The bottom row is a series of axial slices corresponding to the above, but demonstrating NRDI maps. Apparent on this, and not the others, is the extent of peritumoral edema which may be useful for surgeons in preoperative assessment
Fig. 6
Fig. 6
(a)–(d) Images obtained by applying GQI-based reconstruction techniques to diffusion data from various healthy and diseased subjects, acquired using various diffusion MRI protocols on various devices. Subjects in (b)–(d) were acquired using a 32-direction diffusion scheme on a Philips device. DSI studio (http://dsi-studio.labsolver.org) was utilized for reconstruction and fiber tracking. Color scheme of fibers is directional, with green representing anteroposterior oriented fibers, blue representing superoinferior oriented fibers, and red representing horizontally oriented fibers. After GQI reconstruction, a quantitative anisotropy-based generalized deterministic algorithm was utilized to provide whole brainstem reconstruction. This involved only a single ROI, covering the brainstem, cerebellum, and skull base. The maximal fiber turning angle was 60°, the step size was 0.1, the minimal fiber length was 10 mm, and the maximal fiber length was 20 mm. (a) An anterior, oblique, inferosuperior aspect view of the tractographic reconstruction of the brainstem structures of a healthy subject from the Human Connectome Project database (see Panesar et al. [13, 14] for acquisition of parameter details). Visible in a descending order bilaterally are the optic chiasm (Chi.), CN III, CN V, CN VII, CN VIII, and CN IX/X/XI complex. (b) An anterior, oblique, inferosuperior aspect view of the tractographic reconstruction of the brainstem structures of a healthy subject. Visible in a descending order bilaterally are CN II, CN III, CN V, and CN VII/VIII complex. (c) An anterior, oblique, inferosuperior aspect view of the tractographic reconstruction of the brainstem structures of a subject with a giant (Koos IV) left-sided vestibular schwannoma. The tumor has displaced the CN VII/VIII complex anteriorly and superiorly, while CN V has also been displaced superiorly. CN IX/X/XI has been displaced inferiorly and medially, while CN VI has been displaced medially. The tractography approach was beneficial in preoperative planning and led the surgeons to choose a subtemporal approach to the tumor. (d) An anterior, oblique, inferosuperior aspect view of the tractographic reconstruction of the brainstem structures of a subject with a left-sided petroclival meningioma. CN III has been severely displaced upwards by the tumor, while CN V and VI were in close contact. Also visible from this view are the V1/V2/V3 branches of CN V. The tractography approach was beneficial in preoperative planning and led the surgeons to choose a subtemporal approach to the tumor
Fig. 7
Fig. 7
(a), (b) A case of a 48-year-old female initially presented with a history of migraine, occipital neuralgia, and left-sided Horner’s syndrome, initially diagnosed as a left vertebral artery dissection. This was stented without complication. Two years later, she presented to neurosurgical clinic with left-sided eyelid drooping, sluggish left pupil, left frontoparietal headaches, and generalized clumsiness. Subsequent MRI revealed a 2-cm mass suspicious for glioma. She underwent awake craniotomy with stimulation. The tumor was removed without significant postoperative complication. Surgical pathology revealed a WHO grade IV glioblastoma, with IDH1 R132H mutation. (a) A compound superior-aspect axial slice produced in Surgical Theater (Ohio, USA) virtual reality software demonstrating a combination of computerized tomographic imaging (bone windows and vascular structures) overlaid with T1-weighted MRI images and tractography (obtained via DTI rather than HDFT). Visible in the left occipital lobe is a small glioma with possible displacement of left-sided inferior fronto-occipital fasciculus (blue). This software is compatible with commercially available virtual reality (VR) hardware and was used for preoperative planning for this case. (b) A compound posterior-aspect cutaway view of the left hemisphere produced in Surgical Theater software. Visible from this aspect is the overlying bone of the cranium, vascular structures, parenchyma from a T1-weighted MRI, and inferior fronto-occipital (blue) and arcuate (yellow) fasciculi. What is clear is that no fibers are seen to be in close proximity to the tumor. This may be because of the problems with DTI reconstruction techniques demonstrating close-proximity fibers. This software is compatible with commercially available VR hardware and was used for preoperative planning for this case. (c), (d) A case of a 66-year-old female was admitted via the emergency department with symptoms including dizziness, diplopia, nystagmus, partial right-sided VI palsy, and intractable nausea. MRI on admission revealed a hemorrhage within the right middle cerebellar peduncle, from a likely cavernous malformation. She underwent stereotactically guided right retromastoid craniotomy, microscopic resection aided by the use of a microscopic CO2 laser. During surgery, she was found to have hematoma within the right middle cerebellar peduncle, surrounding a 5-mm cavernous malformation. Removal was successful, and she suffered no postoperative complications. (c) A posterior oblique, coronal view using a combination of computerized tomography angiography, T1-weighted MRI, and DTI tractography. Blue fibers represent the bilateral corticospinal tracts, while the orange fibers include those of the middle cerebellar peduncle surrounding the cavernous malformation and possible hematoma. Both the corticospinal tract fibers and middle cerebellar peduncular fibers suffer from false continuity artifacts which are, in fact, corpus callosum fibers. This is a recognized shortcoming of the DTI technique. (d) A right-sided sagittal view using the same imaging sequences described in (c). Clear from this aspect are the orange middle cerebellar peduncular fibers, surrounding the cavernous malformation. The peduncular fibers suffer false continuities with the blue corticospinal tract fibers, while both corticospinal and peduncular fibers falsely blend with fibers of the corpus callosum

Similar articles

Cited by

References

    1. Schmahmann JD, Pandya DN. Cerebral White Matter—Historical Evolution of Facts and Notions Concerning the Organization of the Fiber Pathways of the Brain. J Hist Neurosci. 2007;16(3):237–67. doi: 10.1080/09647040500495896. - DOI - PubMed
    1. de Schotten MT, Dell’Acqua F, Valabregue R, Catani M. Monkey to human comparative anatomy of the frontal lobe association tracts. Cortex. 2012;48(1):82–96. doi: 10.1016/j.cortex.2011.10.001. - DOI - PubMed
    1. Forkel SJ, de Schotten MT, Kawadler JM, Dell’Acqua F, Danek A, Catani M. The anatomy of fronto-occipital connections from early blunt dissections to contemporary tractography. Cortex. 2014;56:73–84. doi: 10.1016/j.cortex.2012.09.005. - DOI - PubMed
    1. Celtikci P, Fernandes-Cabral DT, Yeh F-C, Panesar SS, Fernandez-Miranda JC. Generalized q-sampling imaging fiber tractography reveals displacement and infiltration of fiber tracts in low-grade gliomas. Neuroradiology. 2018;60(3):267–80. doi: 10.1007/s00234-018-1985-5. - DOI - PubMed
    1. Abhinav K, Yeh F-C, Mansouri A, Zadeh G, Fernandez-Miranda JC. High-definition fiber tractography for the evaluation of perilesional white matter tracts in high-grade glioma surgery. Neuro-Oncol. 2015;17(9):1199–209. - PMC - PubMed

Publication types

MeSH terms