. 2019 Jun;32(3):331-341.
doi: 10.1007/s10334-018-0727-3. Epub 2018 Dec 12.

Projection-based respiratory-resolved left ventricular volume measurements in patients using free-breathing double golden-angle 3D radial acquisition

Affiliations

Projection-based respiratory-resolved left ventricular volume measurements in patients using free-breathing double golden-angle 3D radial acquisition

Karen Holst et al. MAGMA. 2019 Jun.

Abstract

Objective: To refine a new technique to measure respiratory-resolved left ventricular end-diastolic volume (LVEDV) in mid-inspiration and mid-expiration using a respiratory self-gating technique and demonstrate clinical feasibility in patients.

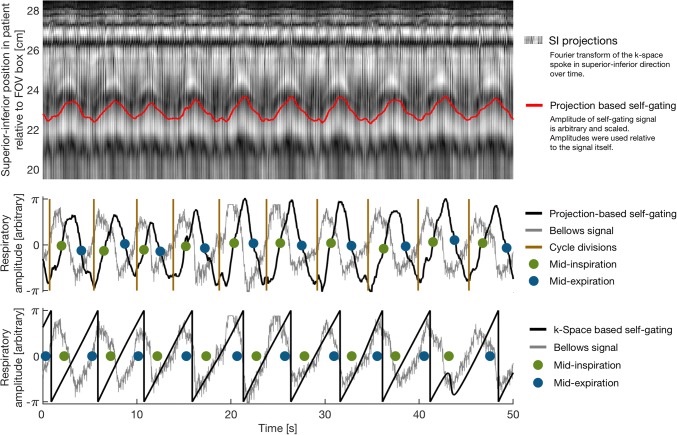
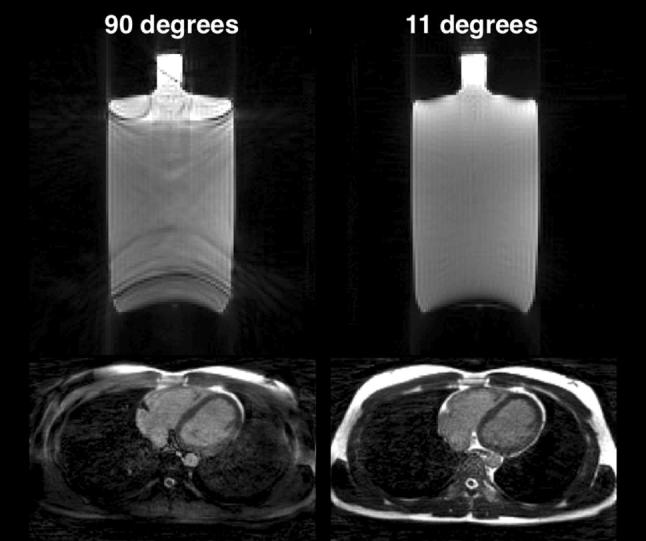
Materials and methods: Ten consecutive patients were imaged at 1.5 T during 10 min of free breathing using a 3D golden-angle radial trajectory. Two respiratory self-gating signals were extracted and compared: from the k-space center of all acquired spokes, and from a superior-inferior projection spoke repeated every 64 ms. Data were binned into end-diastole and two respiratory phases of 15% respiratory cycle duration in mid-inspiration and mid-expiration. LVED volume and septal-lateral diameter were measured from manual segmentation of the endocardial border.

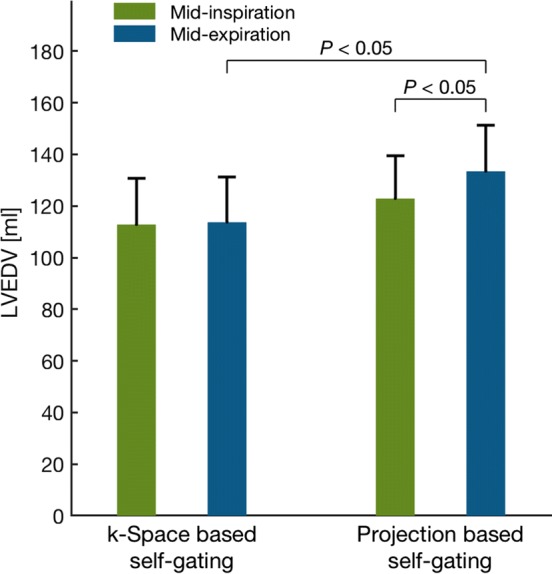
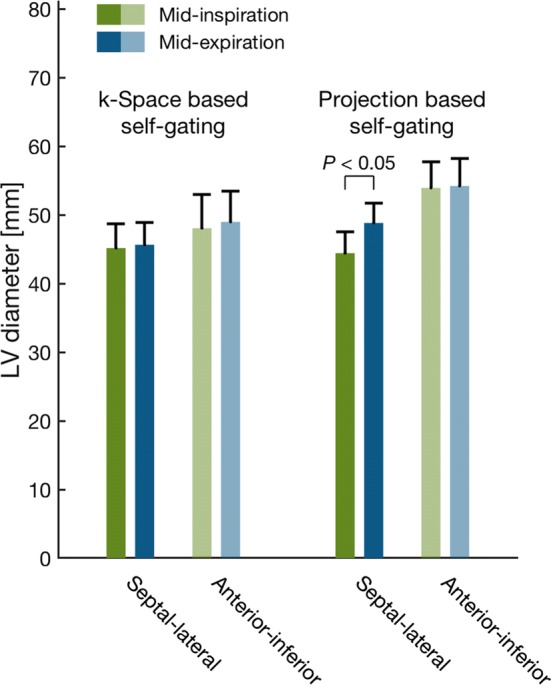
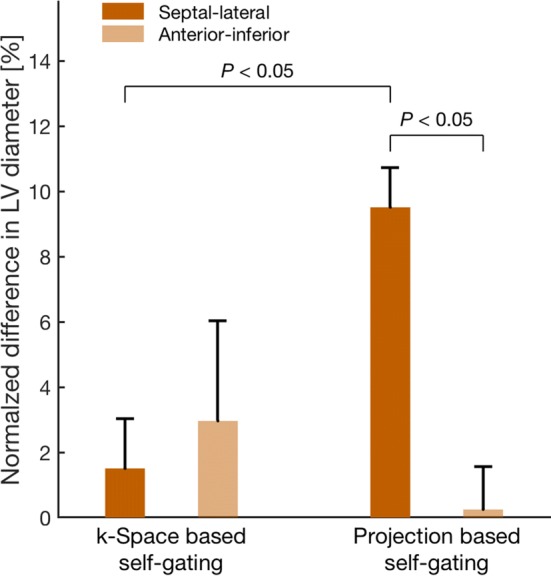
Results: Respiratory-induced variation in LVED size expressed as mid-inspiration relative to mid-expiration was, for volume, 1 ± 8% with k-space-based self-gating and 8 ± 2% with projection-based self-gating (P = 0.04), and for septal-lateral diameter, 2 ± 2% with k-space-based self-gating and 10 ± 1% with projection-based self-gating (P = 0.002).

Discussion: Measuring respiratory variation in LVED size was possible in clinical patients with projection-based respiratory self-gating, and the measured respiratory variation was consistent with previous studies on healthy volunteers. Projection-based self-gating detected a higher variation in LVED volume and diameter during respiration, compared to k-space-based self-gating.

Keywords: Cardiac imaging; Golden-angle; Radial; Respiratory resolved; Self-gating; Three-dimensional.


Conflict of interest statement

All authors declare that they have no conflict of interest.

Figures

Fig. 1
Fig. 1
Examples of respiratory self-gating signals. Top and middle: Projection-based self-gating signal. Top: superior–inferior projections were used to detect the respiratory motion perpendicular to the diaphragm resulting in a projection-based self-gating signal (red). Middle: projection-based self-gating signal (black) compared to the measured bellows signal (gray). The analytic signal angle of the self-gating signal provided the respiratory cycle divisions shown as brown vertical lines, which represented end-expiration. Binning points for mid-inspiration (green) and mid-expiration (blue) were extracted in each cycle using the amplitude of the projection-based self-gating signal. Note how the peak excursion of the projection-based self-gating signal roughly follows that of the bellows signal, with a slight phase shift. Bottom: k-space-based respiratory self-gating signal (black) compared to the measured bellows signal (gray). The k-space-based self-gating signal only provided phase information about the respiration and the 2π-phase wrappings (vertical rapidly decreasing lines) were used to distinguish each respiratory cycle. Note how the amplitude of the k-space-based self-gating signal keeps the same amplitude and only respiratory phase information could be extracted. Also note the change of phase in the first three respiratory periods compared to the following respiratory periods and that the classification of mid-inspiration and mid-expiration is not consistent. 50 representative seconds of the total 10-min scan time are shown
Fig. 2
Fig. 2
Phantom and in vivo experiments demonstrate effect of reducing the mean angle in the golden-angle radial trajectory. The left column corresponds to the original golden-angle trajectory with a mean angle of 90°, while the right column corresponds to the decreased mean angle of 11° which is used in this study, where the decreased mean angle trajectory exhibits less eddy current-induced image artifacts and a more homogenous fat signal across the image and less signal leakage in the lungs. Both the phantom experiment and the in vivo experiment were acquired with a superior–inferior self-navigation spoke which was removed prior to image reconstruction
Fig. 3
Fig. 3
Representative images with projection-based respiratory self-gating from two patients. Images are mid-ventricular short-axis (top row) and four-chamber views (bottom row) from a full image volume covering the whole heart in end-diastole. Left column for each patient: mid-inspiration, representing minimum inspiratory pressure and thereby minimum LVEDV. Right column for each patient: mid-expiration, representing maximum expiratory pressure and thereby maximum LVEDV. Note how the septal position is placed further towards the right ventricle in mid-expiration and further towards the left ventricle in mid-inspiration making the LV larger in mid-expiration, indicated by the white arrows
Fig. 4
Fig. 4
Representative images with k-space-based respiratory self-gating from two patients. Images are mid-ventricular short-axis (top row) and four-chamber views (bottom row) from a full image volume covering the whole heart in end-diastole. Left column for each patient: mid-inspiration, representing minimum inspiratory pressure and thereby minimum LVEDV. Right column for each patient: mid-expiration, representing maximum expiratory pressure and thereby maximum LVEDV. Using the k-space-based self-gating, it is more difficult to see the differences in septal position between the two reconstructed respiratory phases, indicated by the white arrows
Fig. 5
Fig. 5
Mid-ventricular short-axis views from a representative patient. Top row: images with projection-based respiratory self-gating. Bottom row: images with k-space-based respiratory self-gating. Left: mid-inspiration corresponding to minimum inspiratory pressure and thereby minimum LVEDV. Center: Mid-expiration corresponding to maximum expiratory pressure and thereby maximum LVEDV. Right: dashed (maximum LVEDV) and solid (minimum LVEDV) endocardial segmentations are superimposed to illustrate the respiratory induced difference in ventricle size and shape, when reconstructed with the two different self-gating techniques
Fig. 6
Fig. 6
Mean left ventricular end-diastolic volume (LVEDV) during mid-inspiration (green) and mid-expiration (blue). Left: LVEDV from k-space-based self-gating. Right: LVEDV from projection-based self-gating. LVEDV with the projection-based self-gating was higher in mid-expiration compared to mid-inspiration while no difference was found in LVEDV between mid-inspiration and mid-expiration for the k-space-based self-gating. Error bars denote SEM
Fig. 7
Fig. 7
Mean difference between minimum LVEDV and maximum LVEDV relative to maximum LVEDV in percent for k-space-based respiratory self-gating (left) and projection-based respiratory self-gating (right). The difference in LVEDV was higher with the projection-based self-gating compared to the k-space self-gating. Error bars denote SEM
Fig. 8
Fig. 8
Mean LV diameter during mid-inspiration (green) and mid-expiration (blue). Left: LVEDV from k-space-based self-gating. Right: LVEDV from projection-based self-gating. LV diameters were measured in end-diastole from mid-ventricular short-axis images in septal–lateral direction (dark blue and green) and anterior–inferior direction (light blue and green). Only the septal–lateral diameter with the projection-based self-gating differed between mid-inspiration and mid-expiration. Error bars denote SEM
Fig. 9
Fig. 9
Mean respiratory-induced variation in LV diameter expressed as the difference in diameter between mid-inspiration and mid-expiration and normalized to mid-expiration. Variation in LV diameters in septal–lateral direction is shown in dark orange and anterior–inferior direction shown in light orange. Left: respiratory-induced variation in diameters measured in images from k-space-based respiratory self-gating. Right: respiratory-induced variation in diameters measured in images from projection-based respiratory self-gating. The variation in septal–lateral diameter from the projection-based self-gating was higher than from the k-space-based self-gating and no difference was found for the variation in anterior–inferior diameter between the two self-gating methods. Error bars denote SEM

Similar articles

Cited by

References

    1. Maki JH, Chenevert TL, Prince MR. The effects of incomplete breath-holding on 3D MR image quality. J Magn Reson Imaging. 1997;7:1132–1139. doi: 10.1002/jmri.1880070628. - DOI - PubMed
    1. Edelman RR, Manning WJ, Burstein D, Paulin S. Coronary arteries: breath-hold MR angiography. Radiology. 1991;181:641–643. doi: 10.1148/radiology.181.3.1947074. - DOI - PubMed
    1. Wang Y, Christy PS, Korosec FR, Alley MT, Grist TM, Polzin JA, Mistretta CA. Coronary MRI with a respiratory feedback monitor: the 2D imaging case. Magn Reson Med. 1995;33:116–121. doi: 10.1002/mrm.1910330118. - DOI - PubMed
    1. Sigfridsson A, Kvitting JPE, Knutsson H, Wigström L. Five-dimensional MRI incorporating simultaneous resolution of cardiac and respiratory phases for volumetric imaging. J Magn Reson Imaging. 2007;25:113–121. doi: 10.1002/jmri.20820. - DOI - PubMed
    1. Thompson RB, McVeigh E. Cardiorespiratory-resolved magnetic resonance imaging: measuring respiratory modulation of cardiac function. Magn Reson Med. 2006;56:1301–1310. doi: 10.1002/mrm.21075. - DOI - PMC - PubMed