

Revisiting Abnormalities in Brain Network Architecture Underlying Autism Using Topology-Inspired Statistical Inference
- PMID: 30543119
- PMCID: PMC6390667
- DOI: 10.1089/brain.2018.0604
Revisiting Abnormalities in Brain Network Architecture Underlying Autism Using Topology-Inspired Statistical Inference
Abstract
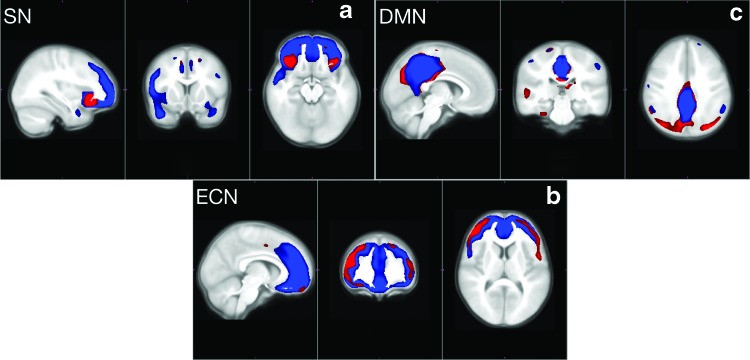
A large body of evidence relates autism with abnormal structural and functional brain connectivity. Structural covariance magnetic resonance imaging (scMRI) is a technique that maps brain regions with covarying gray matter densities across subjects. It provides a way to probe the anatomical structure underlying intrinsic connectivity networks (ICNs) through analysis of gray matter signal covariance. In this article, we apply topological data analysis in conjunction with scMRI to explore network-specific differences in the gray matter structure in subjects with autism versus age-, gender-, and IQ-matched controls. Specifically, we investigate topological differences in gray matter structure captured by structural correlation graphs derived from three ICNs strongly implicated in autism, namely the salience network, default mode network, and executive control network. By combining topological data analysis with statistical inference, our results provide evidence of statistically significant network-specific structural abnormalities in autism.
Keywords: autism; brain networks; statistical inference; structural abnormalities; topological data analysis.
Conflict of interest statement
No competing financial interests exist.
Figures


Similar articles
-
Revisiting Abnormalities in Brain Network Architecture Underlying Autism Using Topology-Inspired Statistical Inference.Connectomics Neuroimaging (2017). 2017 Sep;10511:98-107. doi: 10.1007/978-3-319-67159-8_12. Epub 2017 Sep 2. Connectomics Neuroimaging (2017). 2017. PMID: 30135962 Free PMC article.
-
scMRI reveals large-scale brain network abnormalities in autism.PLoS One. 2012;7(11):e49172. doi: 10.1371/journal.pone.0049172. Epub 2012 Nov 21. PLoS One. 2012. PMID: 23185305 Free PMC article.
-
Sex-dependent structure of socioemotional salience, executive control, and default mode networks in preschool-aged children with autism.Neuroimage. 2022 Aug 15;257:119252. doi: 10.1016/j.neuroimage.2022.119252. Epub 2022 Apr 30. Neuroimage. 2022. PMID: 35500808 Free PMC article.
-
Progress in magnetic resonance imaging of autism model mice brain.Wiley Interdiscip Rev Cogn Sci. 2022 Nov;13(6):e1616. doi: 10.1002/wcs.1616. Epub 2022 Aug 5. Wiley Interdiscip Rev Cogn Sci. 2022. PMID: 35930672 Review.
-
The neuropathology of autism.Brain Pathol. 2007 Oct;17(4):422-33. doi: 10.1111/j.1750-3639.2007.00100.x. Brain Pathol. 2007. PMID: 17919128 Free PMC article. Review.
References
-
- Bullmore E, Sporns O. 2009. Complex brain networks: graph theoretical analysis of structural and functional systems. Nat Rev Neurosci 10:186–198 - PubMed
Publication types
MeSH terms
Grants and funding
LinkOut - more resources
Full Text Sources
Medical
