. 2018 Dec 13:7:e35468.
doi: 10.7554/eLife.35468.

Gene flow mediates the role of sex chromosome meiotic drive during complex speciation

Affiliations

Gene flow mediates the role of sex chromosome meiotic drive during complex speciation

Colin D Meiklejohn et al. Elife. .

Abstract

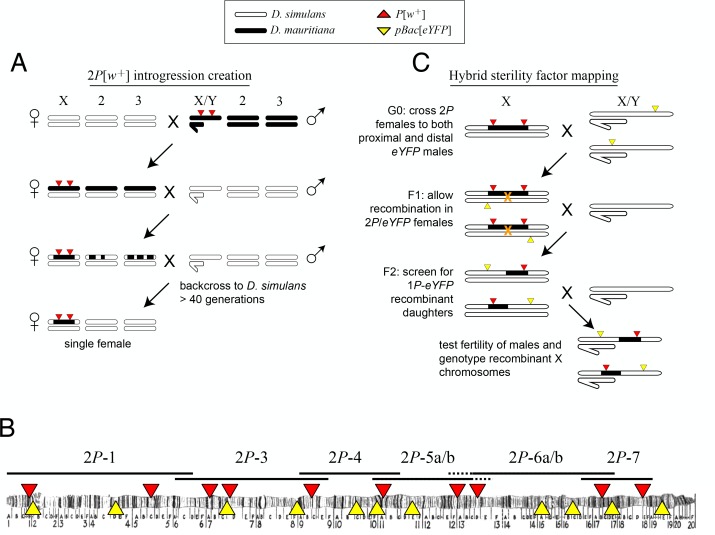
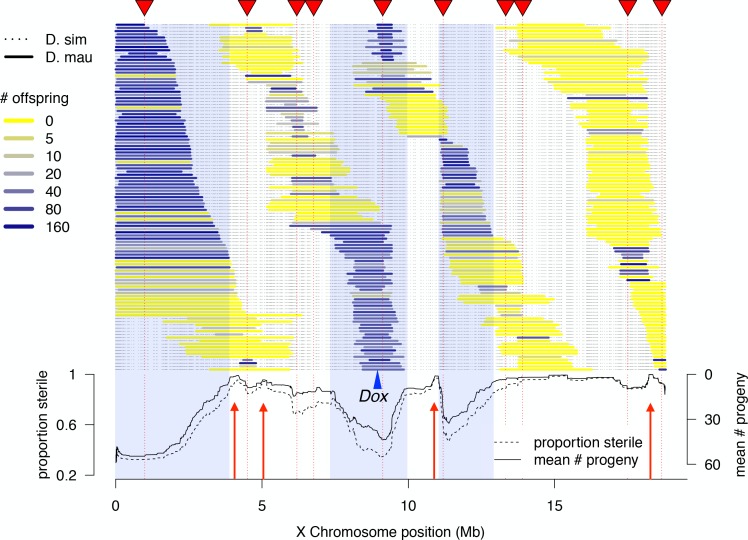
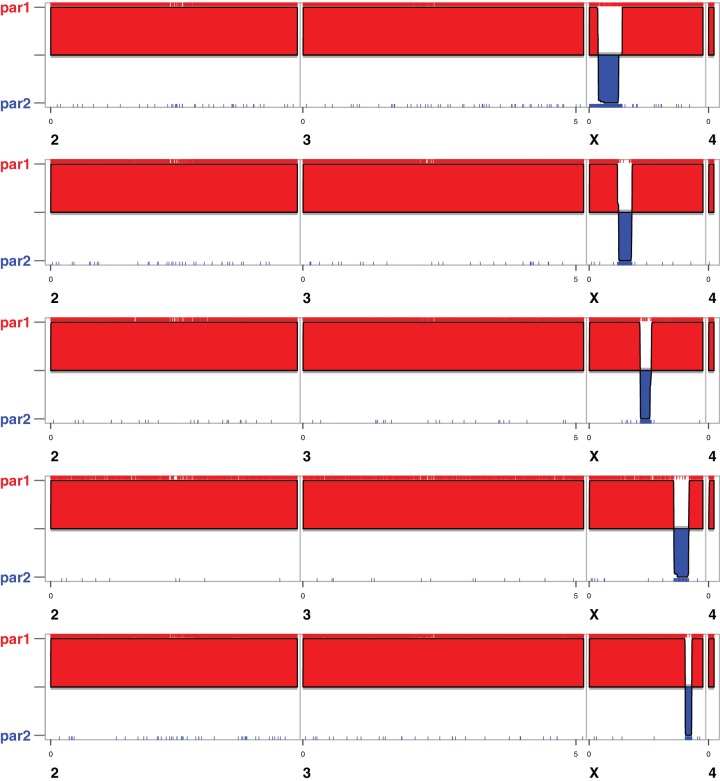
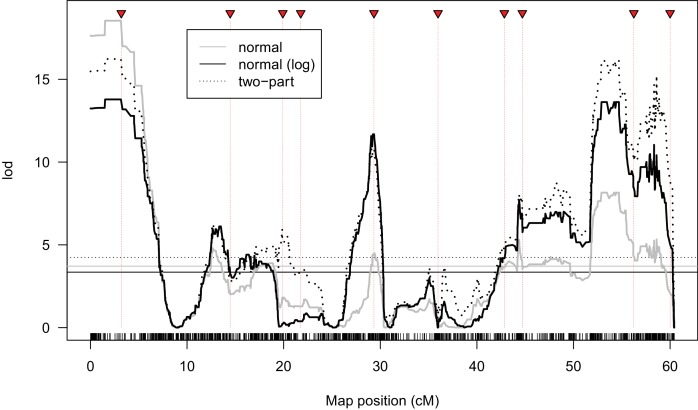
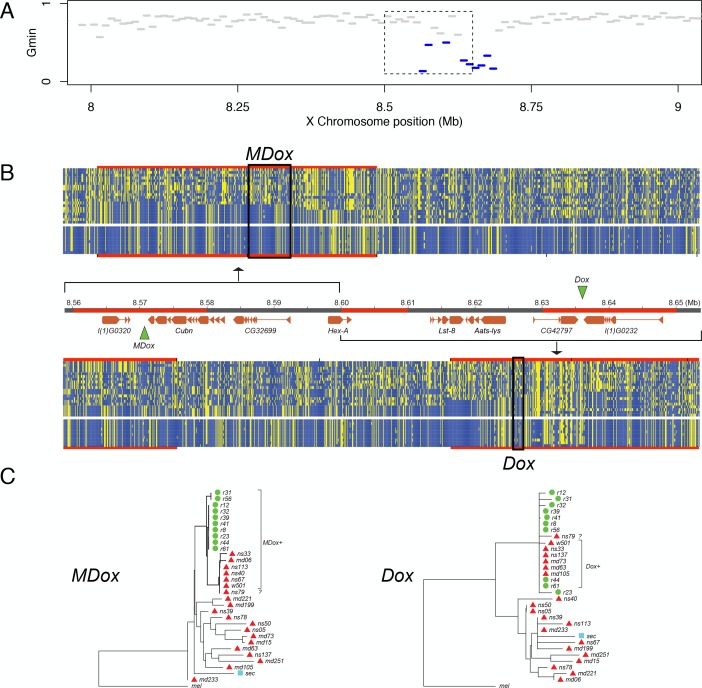
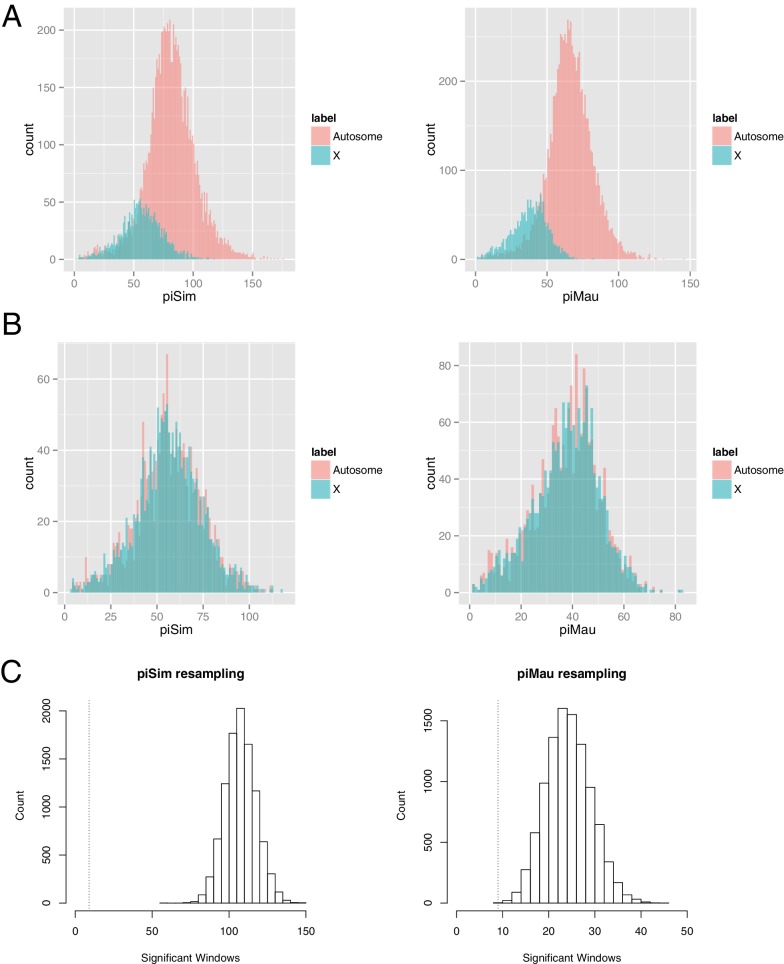
During speciation, sex chromosomes often accumulate interspecific genetic incompatibilities faster than the rest of the genome. The drive theory posits that sex chromosomes are susceptible to recurrent bouts of meiotic drive and suppression, causing the evolutionary build-up of divergent cryptic sex-linked drive systems and, incidentally, genetic incompatibilities. To assess the role of drive during speciation, we combine high-resolution genetic mapping of X-linked hybrid male sterility with population genomics analyses of divergence and recent gene flow between the fruitfly species, Drosophila mauritiana and D. simulans. Our findings reveal a high density of genetic incompatibilities and a corresponding dearth of gene flow on the X chromosome. Surprisingly, we find that a known drive element recently migrated between species and, rather than contributing to interspecific divergence, caused a strong reduction in local sequence divergence, undermining the evolution of hybrid sterility. Gene flow can therefore mediate the effects of selfish genetic elements during speciation.

Keywords: Drosophila mauritiana; Drosophila simulans; evolutionary biology; genetics; genomics; speciation.


Conflict of interest statement

CM, EL, KG, TR, SK, AG, JV, CM, DG, DS, DP No competing interests declared

Figures

Figure 1.
Figure 1.. Crosses used to introgress eight regions of the D. mauritiana X chromosome into a D. simulans genome.
(A) D. mauritiana ‘2P’ lines were constructed by combining pairs of P-element insertions containing the miniwhite transgene (P[w+]; red triangles) distributed across the X chromosome. The P[w+] inserts are semi-dominant visible eye-color markers that permit discrimination of individuals carrying 0, 1 or 2P[w+]. X-linked segments from D. mauritiana were introgressed into a D. simulans genetic background by backcrossing 2P[w+] hybrid females to D. simulans wXD1 males for over 40 generations. Each introgression line was then bottlenecked through a single female to eliminate segregating variation in the recombination breakpoints flanking the 2P[w+] interval. (B) Cytological map of the D. melanogaster X chromosome, indicating the locations of P[w+] and pBac[eYFP] transgene insertions. The extent of regions introgressed from D. mauritiana into D. simulans (e.g. 2P-1) are labeled above the map. Two pairs of introgression genotypes (2P-5a/b and 2P-6a/b) mostly overlap; the regions included in 2P-5b/2P-6b but not 2P-5a/2P-6a are indicated by dashed lines. (C) Meiotic mapping of sterility factors. 2P[w+] females were crossed to D. simulans strains carrying an X-linked pBac[eYFP] transgene (yellow triangles) that was used as an additional visible marker to score recombinant chromosomes. Recombinant X chromosomes with both pBac[eYFP] and a single P[w+] were chosen and assayed for male fertility. Recombinant chromosomes were generated using pBac[eYFP] markers both proximal and distal to each 2P introgression.
Figure 1—figure supplement 1.
Figure 1—figure supplement 1.. Distribution of fertility (number of progeny) among all males carrying recombinant 1P-YFP X chromosomes, and average number of progeny among all 1P-YFP genotypes.
Colored bars and arrow below indicate individual male and mean fertility for D. simulans wXD1, respectively. The mean fertility of 10 replicate D. mauritiana w12 males with D. simulans wXD1 females is 197.2 offspring.
Figure 2.
Figure 2.. High-resolution genetic map of X-linked hybrid male sterility.
Colored horizontal bars indicate the extent of introgressed D. mauritiana alleles for each recombinant 1P-YFP X chromosome. The color of each introgression indicates the mean fertility of 10 replicate males carrying that 1P-YFP X chromosome. The three shaded areas indicate fertile regions within which D. mauritiana introgressions do not cause sterility, whereas the four red arrows indicate small candidate sterility regions. The blue arrowhead indicates the location of the Dox/MDox meiotic drive loci. Lines in the lower panel indicate the average number of offspring and average proportion of sterile males (defined as producing fewer than five offspring) for all 1P-YFP genotypes that carry D. mauritiana alleles at each genotyped SNP.
Figure 2—figure supplement 1.
Figure 2—figure supplement 1.. SNP locations and inferred ancestry for five recombinant 1P-YFP genotypes.
Red ticks indicate D. simulans alleles (par1), blue ticks indicate D. mauritiana alleles (par2), and the red (blue) shaded regions indicate the location of inferred D. simulans (D. mauritiana) ancestry.
Figure 3.
Figure 3.. QTL analysis of male fertility.
Mean offspring counts for each genotype were transformed as log10(N + 1). The top plot shows lod scores for a two-part model that treats completely sterile genotypes as one class, and tests for quantitative effects on fertility among non-sterile genotypes. The solid and dotted gray lines indicate 5% and 1% significance thresholds, respectively, determined from 10,000 permutations. The bottom plot shows the estimated effects of D. simulans and D. mauritiana alleles at QTL placed every 1 cM (bounding lines indicate 95% confidence intervals).
Figure 3—figure supplement 1.
Figure 3—figure supplement 1.. Alternate QTL models of male fertility.
Lod scores are shown for models where offspring counts for each genotype were modeled as a normally distributed variable (normal), log10(N + 1) offspring counts were modeled as a normally distributed variable (normal (log)), or offspring counts were modeled as two classes, completely sterile genotypes as one class, and tests for quantitative effects on fertility among non-sterile genotypes. Horizontal lines indicate 1% significance thresholds determined from 10,000 permutations.
Figure 3—figure supplement 2.
Figure 3—figure supplement 2.. QTL analysis of male fertility incorporating introgression length as a covariate.
Lod scores are shown for analyses where offspring log10(N + 1) offspring counts were treated as a normally distributed variable, without and with introgression length in base-pairs as a covariate. Horizontal lines indicate 1% significance thresholds determined from 10,000 permutations.
Figure 4.
Figure 4.. High-resolution map of progeny sex ratios among fertile 1P-YFP introgression male genotypes.
Colored horizontal bars indicate the extent of introgressed D. mauritiana alleles for each fertile recombinant 1P-YFP X chromosome. The color of each introgression indicates the sex-ratio of progeny from replicate males carrying that 1P-YFP X chromosome. The line below indicates the average progeny sex-ratio for all 1P-YFP genotypes that carry D. mauritiana alleles at each genotyped SNP.
Figure 4—figure supplement 1.
Figure 4—figure supplement 1.. Relationship between progeny number and sex-ratio.
The top panel shows number of progeny and the percentage of daughters for all recombinant 1P-YFP males that produced any offspring and 40 control D. simulans wXD1 males. The bottom panel shows mean number of progeny and mean progeny sex-ratio for all recombinant 1P-YFP genotypes. In all cases, there is a significant positive correlation between fertility and progeny sex-ratio (1P-YFP males: ρ = 0.12, p<0.0001; wXD1 males: ρ=0.44, p=0.009; 1P-YFP genotypes: ρ = 0.21, p=0.0002).
Figure 4—figure supplement 2.
Figure 4—figure supplement 2.. Relationship between introgression length, fertility, and sex-ratio.
Partial correlation coefficients among these three variables: length, fertility: ρ = 0.03, p=0.67; fertility, sex-ratio: ρ = 0.16, p=0.02; length, sex-ratio: ρ = −0.31, p<0.0001). Trendline corresponds to linear regression of progeny sex-ratio on introgression length: sex-ratio = 0.487 - length*0.022.
Figure 4—figure supplement 3.
Figure 4—figure supplement 3.. QTL analysis of progeny sex ratio associated with introgression genotypes.
Top panel includes all males that produced any offspring; bottom panel includes only males that sired more than four offspring and genotypes with at least three males that sired more than four offspring. Grey lines indicate results using all genotypes that met the above criterion; black lines indicate results excluding a single outlier genotype. Solid and dotted lines indicate 5% and 1% significance thresholds determined from 10,000 random permutations, respectively.
Figure 5.
Figure 5.. Identification of introgessed regions by Gmin.
Grey (black) dots indicate Gmin values calculated using 5-kb (10-kb) windows; light blue (dark blue) dots indicate 5-kb (10-kb) windows with significant Gmin values. As with 10-kb windows, 5-kb windows with significant Gmin values are 4-fold underrepresented on the X chromosome: 14 of 3603 5-kb windows on the X chromosome (0.39%) have significant Gmin values versus 266 of 17,065 5-kb windows on the autosomes (1.56%; Fisher’s exact test p<0.0001).
Figure 5—figure supplement 1.
Figure 5—figure supplement 1.. Population genomic scans for polymorphism, divergence, and introgression in 10-kb windows.
The rows of panels show: nucleotide diversity for a sample of 10 inbred strains of D. mauritianamau, green dots) and 20 inbred strains of D. simulanssim, purple dots); nucleotide divergence scaled by within-species polymorphism (blue dots); and Gmin (red dots), the ratio of the minimum number of nucleotide differences per site between D. mauritiana and D. simulans to the average number of differences per site, a summary statistic that is sensitive to introgression. Panels correspond to each major chromosome arm, with genome coordinates on the x-axis.
Figure 5—figure supplement 2.
Figure 5—figure supplement 2.. Polymorphism and Gmin.
Within both D. simulans and D. mauritiana there is a significant negative correlation between polymorphism (π) and Gmin P-value (Spearman's ρ = 0.22 and 0.38, respectively, p<0.0001), indicating that windows with higher polymorphism are more likely to have low Gmin values, although this correlation is driven by the large majority of non-significant windows. However, 10-kb windows with significant Gmin values have lower levels of polymorphism in D. simulans than non-significant windows, while significant windows have higher levels of polymorphism in D. mauritiana than non-significant windows (Wilcoxon rank test p<0.0001 within both species). One interpretation of this pattern is that windows with significant Gmin values have levels of polymorphism similar to that in the other species, which is consistent with these windows carrying lineages derived from the other species.
Figure 6.
Figure 6.. Natural introgression of the MDox-Dox region of the X chromosome.
(A) Gmin values for 10-kb windows in the region containing MDox and Dox. Blue lines indicate windows with significantly low Gmin values. Inset box indicates the 90-kb region shown in panel B. (B) DNA polymorphism tables: the top table corresponds to the MDox region, and the bottom corresponds to the Dox region. Within the tables, yellow squares denote the derived nucleotide state, and blue squares indicate the ancestral state. The top 20 rows of each table correspond to the D. simulans samples, and the bottom 10 rows correspond to the D. mauritiana samples. The genome map between the polymorphism tables shows gene models for the region (orange boxes) and the locations of the MDox and Dox genes (green triangles). Regions highlighted in red are 10-kb windows with significantly low Gmin values. (C) Maximum likelihood phylogenetic trees for the MDox and Dox regions. Green circles and red triangles denote D. mauritiana and D. simulans samples, respectively.
Appendix 1—figure 1
Appendix 1—figure 1. Resampled autosomal 10-kb windows matching X-chromosome polymorphism.
(A) Distributions of polymorphism within 10-kb windows for the X chromosome and autosomes in D. simulans and D. mauritiana. (B) Exemplar resampled autosomal data sets matching X-chromosome polymorphism for D. simulans and D. mauritiana. (C) Distribution of the number of resampled windows with significant Gmin values across 10,000 replicate resampled data sets. Vertical dotted lines indicate the observed number of significant X-linked windows in each species.

Similar articles

Cited by

References

    1. Andolfatto P, Davison D, Erezyilmaz D, Hu TT, Mast J, Sunayama-Morita T, Stern DL. Multiplexed shotgun genotyping for rapid and efficient genetic mapping. Genome Research. 2011;21:610–617. doi: 10.1101/gr.115402.110. - DOI - PMC - PubMed
    1. Ballard JW. Comparative genomics of mitochondrial DNA in members of the Drosophila melanogaster subgroup. Journal of Molecular Evolution. 2000a;51:48–63. doi: 10.1007/s002390010066. - DOI - PubMed
    1. Ballard JW. When one is not enough: introgression of mitochondrial DNA in Drosophila. Molecular Biology and Evolution. 2000b;17:1126–1130. doi: 10.1093/oxfordjournals.molbev.a026394. - DOI - PubMed
    1. Ballard JW. Sequential evolution of a symbiont inferred from the host: Wolbachia and Drosophila simulans. Molecular Biology and Evolution. 2004;21:428–442. doi: 10.1093/molbev/msh028. - DOI - PubMed
    1. Barton N, Bengtsson BO. The barrier to genetic exchange between hybridising populations. Heredity. 1986;57:357–376. doi: 10.1038/hdy.1986.135. - DOI - PubMed

Publication types

LinkOut - more resources