

Full-Length Envelope Analyzer (FLEA): A tool for longitudinal analysis of viral amplicons
- PMID: 30543621
- PMCID: PMC6314628
- DOI: 10.1371/journal.pcbi.1006498
Full-Length Envelope Analyzer (FLEA): A tool for longitudinal analysis of viral amplicons
Abstract
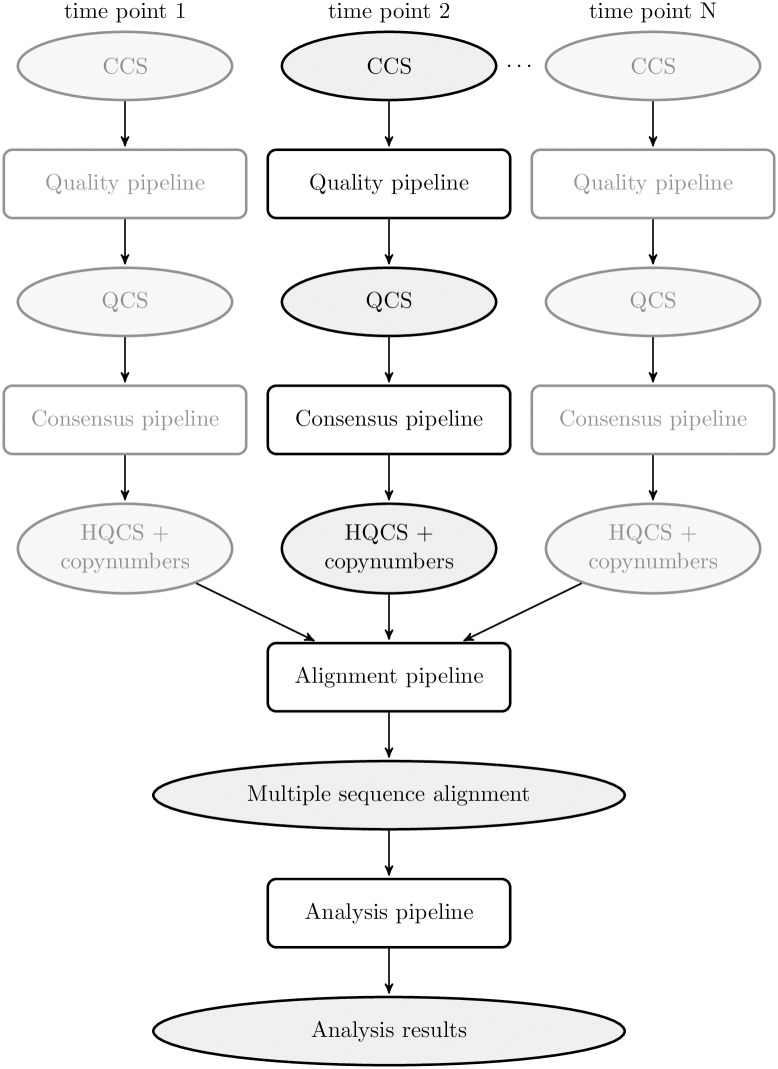
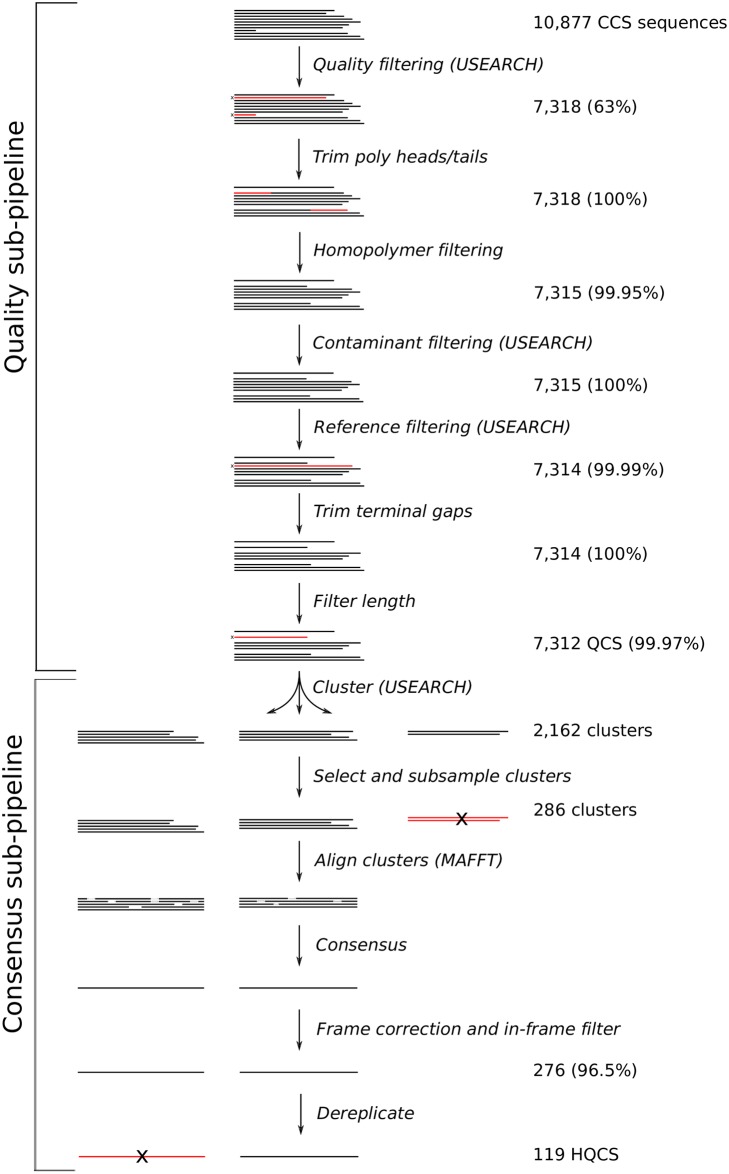
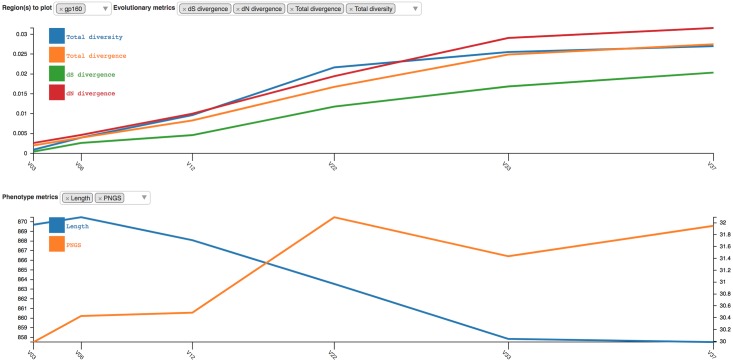
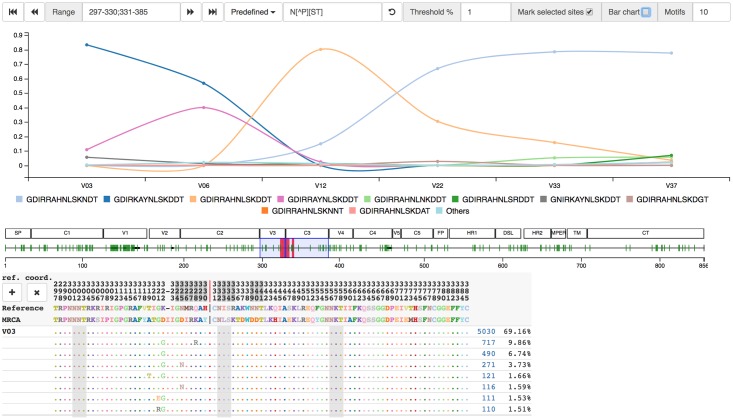
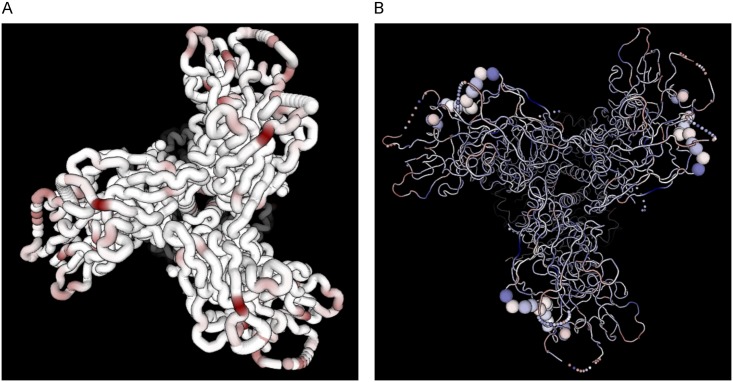
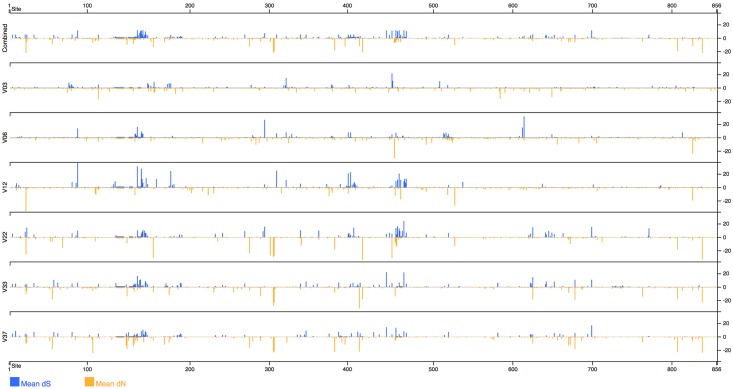
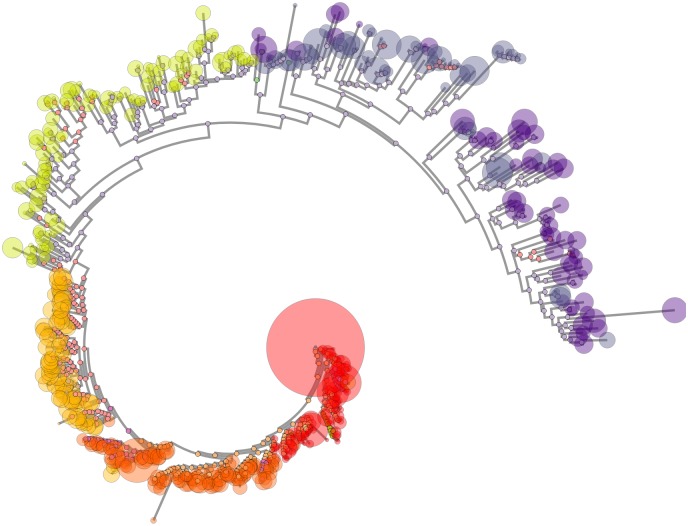
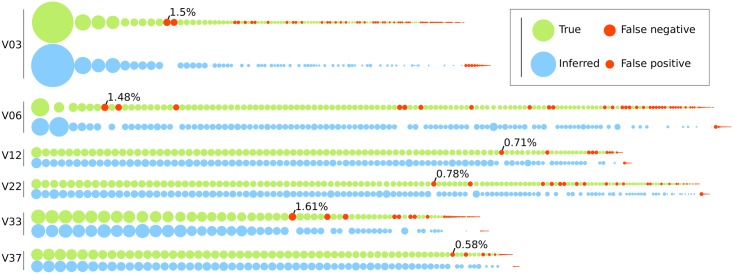
Next generation sequencing of viral populations has advanced our understanding of viral population dynamics, the development of drug resistance, and escape from host immune responses. Many applications require complete gene sequences, which can be impossible to reconstruct from short reads. HIV env, the protein of interest for HIV vaccine studies, is exceptionally challenging for long-read sequencing and analysis due to its length, high substitution rate, and extensive indel variation. While long-read sequencing is attractive in this setting, the analysis of such data is not well handled by existing methods. To address this, we introduce FLEA (Full-Length Envelope Analyzer), which performs end-to-end analysis and visualization of long-read sequencing data. FLEA consists of both a pipeline (optionally run on a high-performance cluster), and a client-side web application that provides interactive results. The pipeline transforms FASTQ reads into high-quality consensus sequences (HQCSs) and uses them to build a codon-aware multiple sequence alignment. The resulting alignment is then used to infer phylogenies, selection pressure, and evolutionary dynamics. The web application provides publication-quality plots and interactive visualizations, including an annotated viral alignment browser, time series plots of evolutionary dynamics, visualizations of gene-wide selective pressures (such as dN/dS) across time and across protein structure, and a phylogenetic tree browser. We demonstrate how FLEA may be used to process Pacific Biosciences HIV env data and describe recent examples of its use. Simulations show how FLEA dramatically reduces the error rate of this sequencing platform, providing an accurate portrait of complex and variable HIV env populations. A public instance of FLEA is hosted at http://flea.datamonkey.org. The Python source code for the FLEA pipeline can be found at https://github.com/veg/flea-pipeline. The client-side application is available at https://github.com/veg/flea-web-app. A live demo of the P018 results can be found at http://flea.murrell.group/view/P018.
Conflict of interest statement
The authors have declared that no competing interests exist.
Figures
Similar articles
-
Improving the sensitivity of long read overlap detection using grouped short k-mer matches.BMC Genomics. 2019 Apr 4;20(Suppl 2):190. doi: 10.1186/s12864-019-5475-x. BMC Genomics. 2019. PMID: 30967123 Free PMC article.
-
PyBamView: a browser-based application for viewing short read alignments.Bioinformatics. 2014 Dec 1;30(23):3405-7. doi: 10.1093/bioinformatics/btu565. Epub 2014 Aug 21. Bioinformatics. 2014. PMID: 25147359
-
Characterization of Hepatitis C Virus (HCV) Envelope Diversification from Acute to Chronic Infection within a Sexually Transmitted HCV Cluster by Using Single-Molecule, Real-Time Sequencing.J Virol. 2017 Feb 28;91(6):e02262-16. doi: 10.1128/JVI.02262-16. Print 2017 Mar 15. J Virol. 2017. PMID: 28077634 Free PMC article.
-
Alignment of Next-Generation Sequencing Reads.Annu Rev Genomics Hum Genet. 2015;16:133-51. doi: 10.1146/annurev-genom-090413-025358. Epub 2015 May 4. Annu Rev Genomics Hum Genet. 2015. PMID: 25939052 Review.
-
A comprehensive evaluation of long read error correction methods.BMC Genomics. 2020 Dec 21;21(Suppl 6):889. doi: 10.1186/s12864-020-07227-0. BMC Genomics. 2020. PMID: 33349243 Free PMC article. Review.
Cited by
-
Long-read amplicon denoising.Nucleic Acids Res. 2019 Oct 10;47(18):e104. doi: 10.1093/nar/gkz657. Nucleic Acids Res. 2019. PMID: 31418021 Free PMC article.
-
Rapid and Focused Maturation of a VRC01-Class HIV Broadly Neutralizing Antibody Lineage Involves Both Binding and Accommodation of the N276-Glycan.Immunity. 2019 Jul 16;51(1):141-154.e6. doi: 10.1016/j.immuni.2019.06.004. Immunity. 2019. PMID: 31315032 Free PMC article.
-
Vaccine-Induced Protection from Homologous Tier 2 SHIV Challenge in Nonhuman Primates Depends on Serum-Neutralizing Antibody Titers.Immunity. 2019 Jan 15;50(1):241-252.e6. doi: 10.1016/j.immuni.2018.11.011. Epub 2018 Dec 11. Immunity. 2019. PMID: 30552025 Free PMC article.
-
High-throughput amplicon sequencing of the full-length 16S rRNA gene with single-nucleotide resolution.Nucleic Acids Res. 2019 Oct 10;47(18):e103. doi: 10.1093/nar/gkz569. Nucleic Acids Res. 2019. PMID: 31269198 Free PMC article.
References
Publication types
MeSH terms
Grants and funding
LinkOut - more resources
Full Text Sources
Molecular Biology Databases
