. 2018 Dec 13;14(12):e1007729.
doi: 10.1371/journal.pgen.1007729. eCollection 2018 Dec.

Ribonuclease H1-targeted R-loops in surface antigen gene expression sites can direct trypanosome immune evasion

Affiliations

Ribonuclease H1-targeted R-loops in surface antigen gene expression sites can direct trypanosome immune evasion

Emma Briggs et al. PLoS Genet. .

Abstract

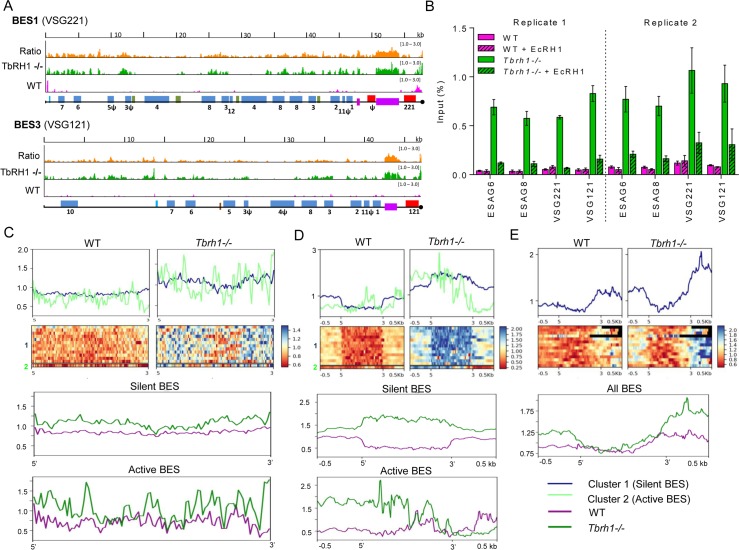
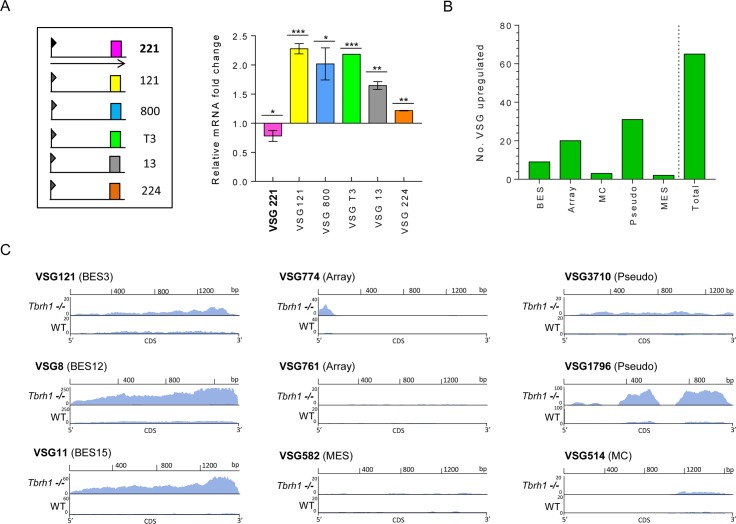
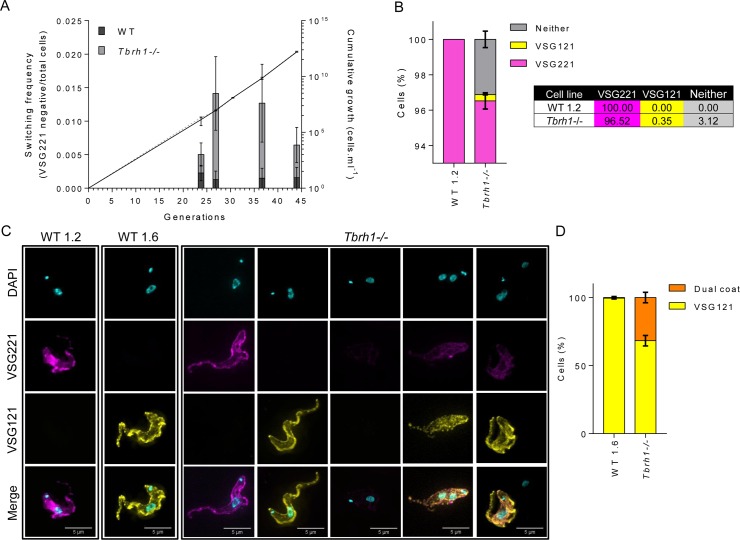
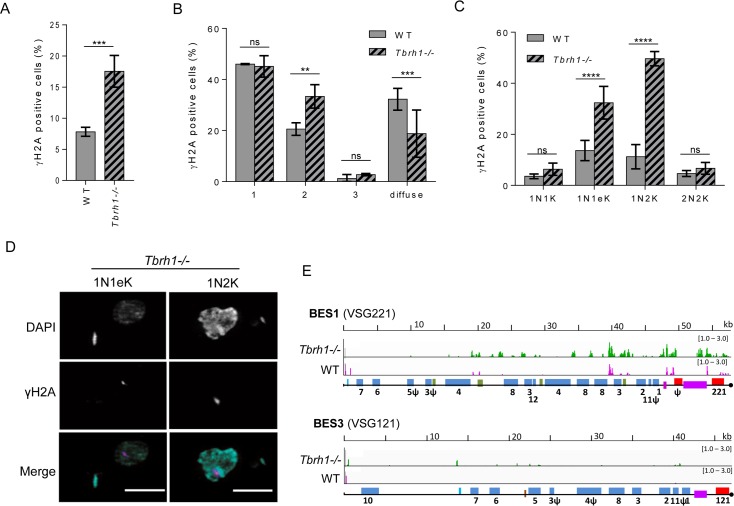
Switching of the Variant Surface Glycoprotein (VSG) in Trypanosoma brucei provides a crucial host immune evasion strategy that is catalysed both by transcription and recombination reactions, each operating within specialised telomeric VSG expression sites (ES). VSG switching is likely triggered by events focused on the single actively transcribed ES, from a repertoire of around 15, but the nature of such events is unclear. Here we show that RNA-DNA hybrids, called R-loops, form preferentially within sequences termed the 70 bp repeats in the actively transcribed ES, but spread throughout the active and inactive ES, in the absence of RNase H1, which degrades R-loops. Loss of RNase H1 also leads to increased levels of VSG coat switching and replication-associated genome damage, some of which accumulates within the active ES. This work indicates VSG ES architecture elicits R-loop formation, and that these RNA-DNA hybrids connect T. brucei immune evasion by transcription and recombination.


Conflict of interest statement

The authors have declared that no competing interests exist.

Figures

Fig 1
Fig 1. T. brucei ribonuclease H1 is a non-essential nuclear protein.
A. Representative immunofluorescence images of T. brucei cells expressing Ribonuclease H1 (TbRH1) as a fusion with 12 copies of the myc epitope (TbRH112myc); wildtype (WT) cells are shown for comparison. Anti-myc signal is shown in red and DNA is stained with DAPI (blue); merged DAPI and anti-myc signal is also shown, as is the cell outline (by differential interference contrast microscopy; DIC). Scale bars, 5 μm. B. Super-resolution structure-illumination imaging of TbRH1 and nuclear DNA colocalisation; TbRH112myc expressing cells are shown stained with anti-myc antiserum and with DAPI; representative images are shown of different cell cycles stages, and only in the merge of anti-myc (magenta) and DAPI (cyan) images is colour provided. Graphs plot length across the nucleus (x, pixels) versus mean pixel intensity at each position (y, arbitrary units) for DAPI (aqua) and TbRH1 (pink). Scale bars, 5 μm. C. Growth of WT cells and T. brucei TbRH1 heterozygous (TbRH1+/-) or homozygous Tbrh1-/- mutants in culture, with mean population density shown at 24 hr intervals; error bars denote SD from three experiments. D. Percentage of the population of WT and Tbrh1-/- cells in discernible cell cycle stages, determined by DAPI staining and fluorescent imaging followed by counting the number and shape of nuclear (N) and kinetoplast (K) structures in individual cells: 1N1K, 1N2K and 2N2K and ‘other’ cells that do not conform to these patterns (>200 cells were counted for each cell type).
Fig 2
Fig 2. Localisation of R-loops in the Variant Surface Glycoprotein expression sites of T. brucei before after loss of RNase H1.
A. Localisation of R-loops by DRIP-seq in wild type (WT) and T. brucei RNase H1 homozygous mutant (Tbrh1-/-) bloodstream form cells. DRIP-seq signal is shown mapped to BES1 (the predominantly active VSG expression site (ES) of WT cells) and BES3 (which is mainly inactive); general structural organisation of the T. brucei BES is summarised in Fig 5. Pink and green tracks show normalised ratios of read-depth fold-change (1–3 fold) in IP samples relative to input in WT and Tbrh1-/- mutants, respectively, while the orange tracks show the ratio of IP enrichment in Tbrh1-/- cells compared with WT. Promoters (aqua), ESAGs (blue, numbered), 70-bp repeats (purple) and VSGs (red) are annotated as boxes; pseudogenes are indicated (ψ), hypothetical genes are shown in green, and the end of the available ES sequence is denoted by a black circle. B. DRIP-qPCR, with or without E.coli RNase H1 (EcRH1) treatment, showing the percentage of PCR amplification in the IP sample relative to input for WT cells (pink) and Tbrh1-/- mutants (green); error bars display SEM for at least three technical replicates and data are shown for two biological replicates (1 and 2). C-E. DRIP-seq signal fold-change (IP relative to input samples) is shown on the y-axes, plotted as heatmaps and average signal fold-change profiles over ES regions encompassing the ESAGs (C), 70-bp repeats (D) and VSG (E); for each region, 5’ and 3’ (x-axes) denote the upstream and downstream boundaries, and in some cases -/+ 0.5 kb of flanking sequence is shown. Upper two panels: comparison of WT and Tbrh1-/- DRIP-seq signal using K-means clustering, which separated the active (light green, cluster 2) and inactive (dark blue, cluster 1) ES when analysing ESAGs and 70 bp repeats, but not VSGs. Lower panels: Overlay of WT (purple) and Tbrh1-/- (green) DRIP-seq signals in the three ES regions, with the active and silent ES displayed separately for the ESAGs and 70 bp repeats.
Fig 3
Fig 3. Loss of T. brucei RNase H1 results in increased transcription of silent VSGs.
A. The left panel provides a simplified diagram of VSG expression sites (ES) used to generate a protective surface coat in the bloodstream T. brucei cells used in this study; only telomere-proximal VSGs (coloured boxes, numbered) from a selection of ES are shown, and the single ES being actively transcribed (encoding VSG221, pink) is denoted by an arrow extending from the promoter (flag). The right panel shows a graph of VSG RNA levels (corresponding to the ES diagram, and determined by RT-qPCR) in TbRH1 null mutants (Tbrh1-/- cells), plotted as fold-change relative to levels of the cognate VSG RNA in wild type cells (WT427 1.2); VSG 221 is in bold to indicate it is in the active ES of wild type cells, and data are presented as mean +/- SD for three independent experiments; * P < 0.05, ** P < 0.005, *** P < 0.0005 (one-way t-test). B. A graph depicting the number of VSG genes that display >1.5-fold increase in RNA abundance (determined by RNA-seq, and normalised to gene length and total number of reads) in Tbrh1-/- cells relative to WT; the total number is sub-categorised depending on whether the VSGs have been localised to the bloodstream ES (BES), are intact genes in the subtelomeric arrays (array), are in mini-chromosomes (MC), are pseudogenes (pseudo), or are in the ES transcribed in the metacyclic life cycle stage (MES). C. Plots of normalised RNA-seq read depth abundance (y-axes) relative to CDS position (x-axes) for a selection of the above VSGs; VSG identity numbers are from [16].
Fig 4
Fig 4. Loss of T. brucei RNase H1 induces VSG coat switching.
A. Evaluation of the frequency at which Tbrh1-/- and WT cells switch off expression of VSG221 on their cell surface. For each cell type, three VSG221-expressing clones were generated and grown independently, by serial passage in culture, for a number of generations. At multiple time points the number of cells in the populations express or do not express VSG221 was assessed by immunofluorescence with anti-VSG221 antiserum; non-VSG221 expressing WT (black) and Tbrh1-/- (grey) cells are shown as a proportion of the total population (data shows average and SD of the three clones, and >200 cells were counted for each clone and at each time point). Cumulative density of WT (solid line) and Tbrh1-/- cells (dotted line) over the course of the analysis is shown; values depict average density and SD for the three clones of each cell type at the passages shown. B Percentage of WT (WT 1.2) and Tbrh1-/- cells expressing VSG221 or VSG121 on their surface, as determined by co-immunofluorescence imaging with anti-VSG221 and VSG121 antiserum. The graph depicts the relative proportions of cells in the population in which only VSG221 (magenta) or VSG121 (yellow) could be detected, as wells as cell with both (orange) or neither (grey) of the two VSG on their surface; >200 cells were analysed for each cell type in each of three replicates (error bars denote SEM). C. Co-immunofluorescence imaging of VSG221 and VSG121, providing examples of the surface coat configurations measured in (B); in addition to WT 1.2 cells and Tbrh1-/- mutants, an example of a cell is shown from a T. brucei strain (WT 1.6)[54] that predominantly expresses VSG121 and not VSG221 (Scale bars, 5 μm). D. Analysis of WT 1.6 and Tbrh1-/- mutant cells that express VSG121 on the cell surface, showing the percentages that simultaneously express VSG221 (orange) or only express VSG121 (yellow); >100 cells were analysed in each of three replicate experiments for each cell type.
Fig 5
Fig 5. Models of R loop accumulation and resolution in the VSG expression sites of wild type and RNase H1 mutant T. brucei bloodstream form cells.
The topmost diagram summarises the structure of and transcription across (red arrows) the active VSG expression site (ES, black line), including key features: telomere repeats (white arrows), the VSG gene (red box), 70 bp repeats (hatched box), ESAG genes (white boxes) and the promoter (flag). In the active ES transcription by RNA Polymerase (Pol) I must occur at high levels in order to generate sufficient VSG to form a dense surface coat. Pol I (red circle) passage is slowed when traversing the 70 bp repeats (dotted arrow), leading to the formation of R loops (DNA-RNA hybrid and extruded single strand DNA) that RNase H1 (blue circle) resolves to allow continued transcription. In TbRNaseH1 null mutants (-/-) R loops accumulate in the 70 bp repeats, obstructing transcription and leading to upstream RNA Pol I stalls and the formation of R loops across the length of the ES. Two outcomes of can then occur. In the first, reduced expression of the active ES and VSG is lethal, allowing selection for cells that have activated a distinct ES and VSG (green box). The lack of R-loop resolution by TbRNaseH1 in this site then results in R-loop accumulation and selection for activation of further ES (not shown). In the second outcome, R loops in the active ES lead to, or result from DNA damage, which is then repaired by homologous recombination, resulting in the transfer of sequence (e.g. VSGs, ESAGs) from the silent archive, including the silent ES, into the active ES.
Fig 6
Fig 6. Loss of T. brucei RNase H1 leads to increased levels of nuclear damage in replicating cells and in the VSG expression site.
A. Percentage of WT and Tbrh1-/- cells (n >200 in each of three replicates) that have detectable nuclear anti-γ-H2A signal. Data shown as mean +/- SD; *** P < 0.001 (unpaired t-test). B. Distribution of intra-nuclear γ-H2A signal in WT and Tbrh1-/- cells (n >200 in each of three replicates). Data shown as mean +/- SD; ** P < 0.01, *** P < 0.001, ns not significant (two-way ANOVA test). C. Percentage of cell cycle stages in WT and Tbrh1-/- cells with nuclear anti-γ-H2A signal; cell cycle stages were determined by DAPI staining and fluorescent imaging followed by counting the number and shape of nuclear (N) and kinetoplast (K) structures in individual cells: 1N1K, 1N1elongated K (1N1eK), 1N2K and 2N2K (n ≥50 for each cell cycle stage in three replicates). Data shown and analysed as in C; **** P < 0.0001. D. Super-resolution structure-illumination microscopy imaging of anti-γ-H2A signal and co-localisation with DAPI in representative replicating (1N1eK and 1N2K; see below) Tbrh1-/- cells; only in the merge of anti-γ-H2A (magenta) and DAPI (cyan) images is colour provided (further examples of mutant and WT cells are provided in S5 Fig). E. Localisation of γ-H2A by ChiP-seq in WT and Tbrh1-/- cells. ChiP-seq signal is shown mapped to BES1 and BES3, which are represented as in Fig 2. Magenta and green tracks show normalised ratios of read-depth fold-change (1–3 fold) in IP samples relative to input in WT and Tbrh1-/- mutants, respectively.

Comment in

  • R-loops modulate Trypanosome antigenic variation.
    Prister LL, Seifert HS. Prister LL, et al. PLoS Genet. 2018 Dec 13;14(12):e1007809. doi: 10.1371/journal.pgen.1007809. eCollection 2018 Dec. PLoS Genet. 2018. PMID: 30543632 Free PMC article. No abstract available.

Similar articles

Cited by

References

    1. Yao MC, Chao JL, Cheng CY. Programmed Genome Rearrangements in Tetrahymena. Microbiology spectrum. 2014;2(6). 10.1128/microbiolspec.MDNA3-0012-2014 . - DOI - PubMed
    1. Sterkers Y, Crobu L, Lachaud L, Pages M, Bastien P. Parasexuality and mosaic aneuploidy in Leishmania: alternative genetics. Trends in parasitology. 2014;30(9):429–35. 10.1016/j.pt.2014.07.002 . - DOI - PubMed
    1. Ubeda JM, Raymond F, Mukherjee A, Plourde M, Gingras H, Roy G, et al. Genome-wide stochastic adaptive DNA amplification at direct and inverted DNA repeats in the parasite Leishmania. PLoS biology. 2014;12(5):e1001868 10.1371/journal.pbio.1001868 ; PubMed Central PMCID: PMC4028189. - DOI - PMC - PubMed
    1. Lee CS, Haber JE. Mating-type Gene Switching in Saccharomyces cerevisiae. Microbiology spectrum. 2015;3(2):MDNA3-0013-2014. 10.1128/microbiolspec.MDNA3-0013-2014 . - DOI - PubMed
    1. Klar AJ, Ishikawa K, Moore S. A Unique DNA Recombination Mechanism of the Mating/Cell-type Switching of Fission Yeasts: a Review. Microbiology spectrum. 2014;2(5). 10.1128/microbiolspec.MDNA3-0003-2014 . - DOI - PMC - PubMed

Publication types

MeSH terms