. 2018 Dec 13;16(12):e2006660.
doi: 10.1371/journal.pbio.2006660. eCollection 2018 Dec.

Direct visualization of single-molecule membrane protein interactions in living cells

Affiliations

Direct visualization of single-molecule membrane protein interactions in living cells

Do-Hyeon Kim et al. PLoS Biol. .

Abstract

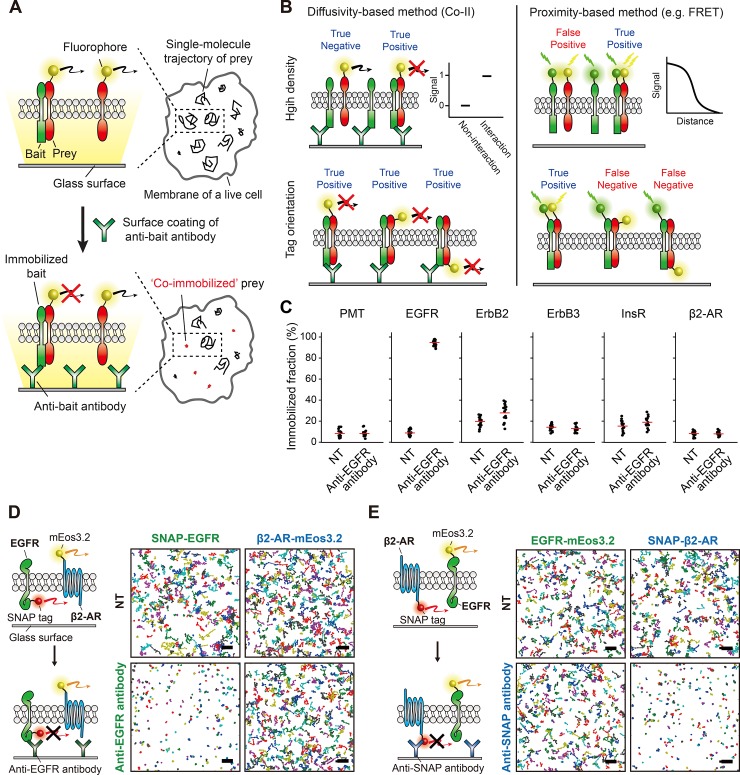
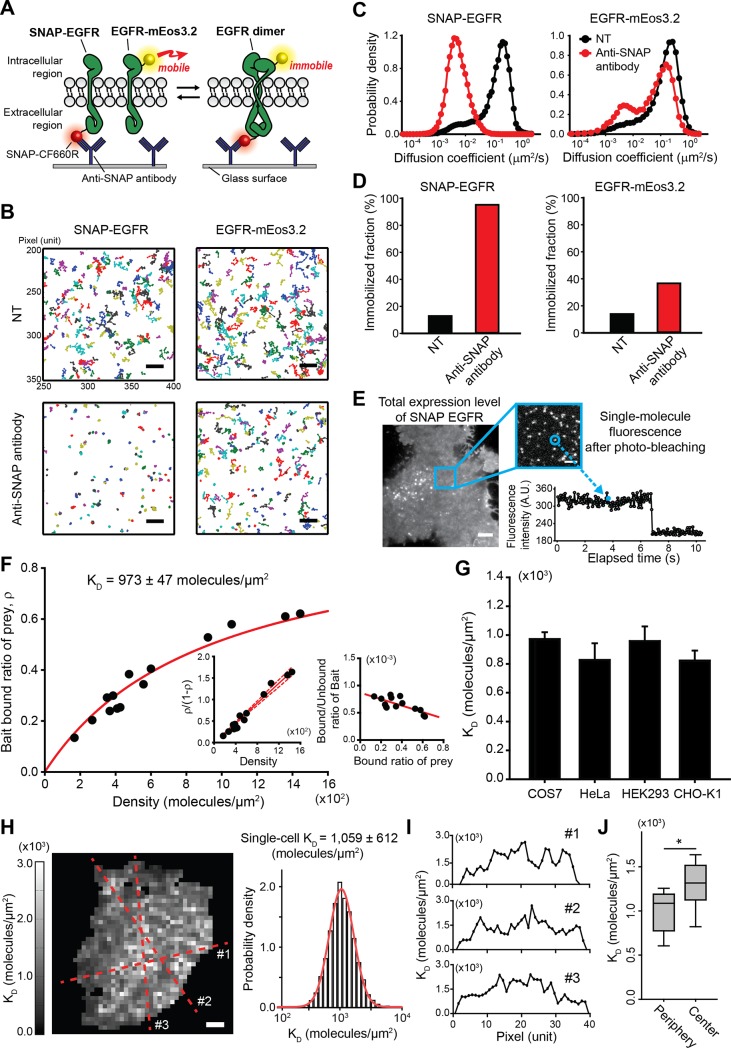
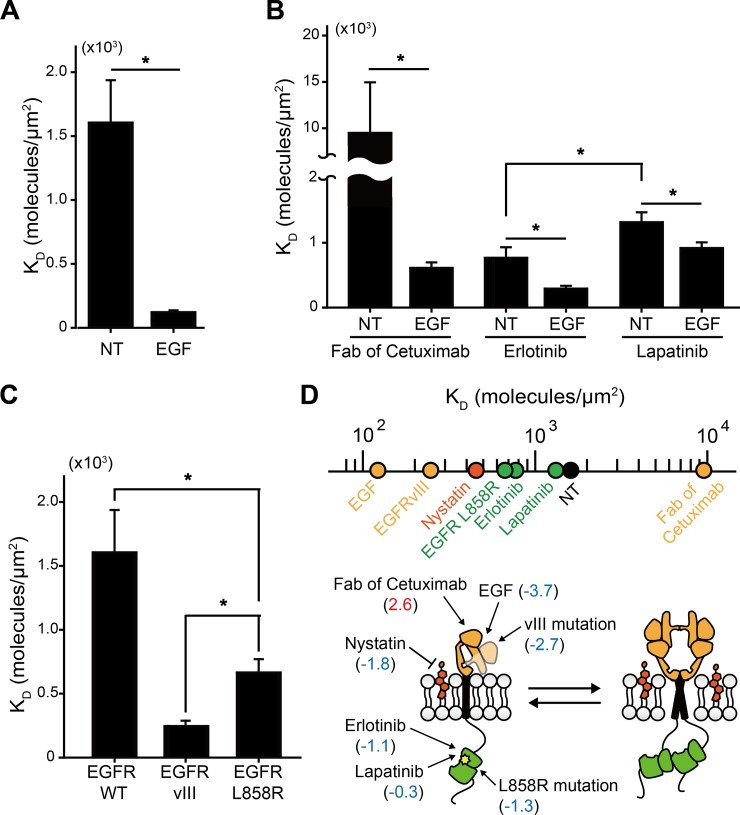
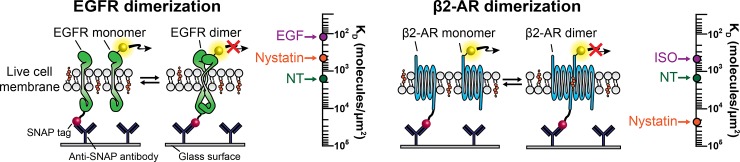
Interactions between membrane proteins are poorly understood despite their importance in cell signaling and drug development. Here, we present a co-immunoimmobilization assay (Co-II) enabling the direct observation of membrane protein interactions in single living cells that overcomes the limitations of currently prevalent proximity-based indirect methods. Using Co-II, we investigated the transient homodimerizations of epidermal growth factor receptor (EGFR) and beta-2 adrenergic receptor (β2-AR) in living cells, revealing the differential regulation of these receptors' dimerizations by molecular conformations and microenvironment in a plasma membrane. Co-II should provide a simple, rapid, and robust platform for visualizing both weak and strong protein interactions in the plasma membrane of living cells.


Conflict of interest statement

The authors have declared that no competing interests exist.

Figures

Fig 1
Fig 1. Membrane protein interactions are directly visualized using co-immunoimmobilization (Co-II).
(A) Schematic of the Co-II assay. The interaction between a fluorescently labeled prey protein and a bait protein is specifically probed by the co-immobilized prey produced after antibody-induced immobilization of the bait protein, which is visualized using sptPALM in single living cells. (B) Comparison between a diffusivity-based method (Co-II) and a proximity-based method (e.g., FRET). In the crowded membrane of living cells, Co-II specifically detects genuine interactions between membrane proteins, while the proximity-based methods are vulnerable to producing false positive signals because a prey and a bait are located nearby. Co-II captures membrane protein interactions independent of tag orientation, while the proximity-based methods require a careful design for donor–acceptor orientation. (C) The bait-specific immobilization using a surface-coated antibody in living cells. The immobilized fractions of PMT, EGFR, ErbB2, ErbB3, InsR, and β2-AR in multiple cells before (NT) and after anti-EGFR antibody treatment. Examined membrane proteins were expressed at a level at least 10 times higher than the expression level of EGFR to avoid the specific co-immobilization resulting from the genuine interaction with EGFR. Each dot represents single-cell data, and the red solid lines indicate the average of the immobilized fraction obtained from multiple cells (n > 10). (D–E) Illustration and trajectory maps for validation of molecule-specific immobilization in the plasma membrane of a living cell. A total of 400 trajectories are shown in each trajectory map. Scale bar, 2 μm. SNAP-EGFR was specifically and almost completely immobilized by anti-EGFR antibody treatment, whereas the immobilized fraction of β2-AR-mEos3.2 was not altered (D). Specific immobilization of β2-AR against EGFR was confirmed vice versa using SNAP-β2-AR and EGFR-mEos3.2 with anti-SNAP antibody (E). β2-AR, beta-2 adrenergic receptor; EGFR, epidermal growth factor receptor; ErbB2, erb-b2 receptor tyrosine kinase 2; ErbB3, erb-b2 receptor tyrosine kinase 3; FRET, fluorescence resonance energy transfer; InsR, insulin receptor; mEos3.2, monomeric Eos fluorescent protein variant 3.2; NT, not treated; PMT, plasma membrane targeting; SNAP, SNAP-tag; sptPALM, single-particle tracking photoactivated localization microscopy.
Fig 2
Fig 2. Equilibrium dissociation constant of EGFR pre-dimerization is determined using Co-II.
(A) Schematic representation of the KD measurement of EGFR homodimerization using Co-II. EGFR-mEos3.2 becomes co-immobilized only when interacting with the surface-immobilized SNAP-EGFR by an anti-SNAP antibody; otherwise, it remains in a mobile state. (B) Trajectory map of CF660R-labeled SNAP-EGFR and EGFR-mEos3.2 before and after anti-SNAP antibody treatment in the same single COS7 cell growing with 10% FBS. A total of 200 trajectories are shown in each trajectory map. Scale bar, 3 μm. (C) Diffusion-coefficient distribution of SNAP-EGFR and EGFR-mEos3.2 before (black line) and after anti-SNAP antibody treatment (red line). The immobilization criteria are presented as a blue dashed line. (D) The immobilized fractions of SNAP-EGFR and EGFR-mEos3.2 before and after anti-SNAP antibody treatment. (E) Fluorescence images of total expression and single-molecule–level expression of SNAP-EGFR. Scale bars, 5 μm and 2 μm, respectively. A fluorescence intensity profile of single SNAP-EGFR shows a single bleaching step. (F) KD analysis using a binding curve of prey EGFR to bait EGFR (y-axis) with respect to the density of the antibody-induced immobilized bait EGFR (x-axis). The bound/unbound ratio of the prey with respect to the density is shown (left inset) with a linear fit (red solid line) and a 95% confidence interval (red dashed lines). Scatchard plot for EGFR pre-homodimerization is shown (right inset). The KD was determined in DMEM supplemented with 10% FBS at 37 °C. Each dot indicates data obtained from individual cells. (G) KD of EGFR pre-homodimerization measured in various cell lines. The error bars represent the SEM at the single-cell level (n > 4). (H) A spatial KD map of EGFR pre-homodimerization and the log-normal distribution of the KD values obtained from different regions of plasma membrane in a single living cell. Scale bar, 5 μm. (I) The KD profiles obtained from the cross sections corresponding to the red dashed lines in panel H. (J) The box plots displaying the distributions of KD values obtained from periphery or center regions of each single cell. n = 10. *p < 0.05 (Student t test). A.U., arbitrary unit; DMEM, Dulbecco's Modified Eagle Medium; EGFR, epidermal growth factor receptor; FBS, fetal bovine serum; mEos3.2, monomeric Eos fluorescent protein variant 3.2; SNAP, SNAP-tag.
Fig 3
Fig 3. EGFR dimerization is distinctively regulated by various molecular perturbations in the membrane of living cells.
(A–B) KD values of EGFR homodimerization measured with and without EGF under the treatment of nonnatural ligands, including a Fab fragment of cetuximab and two types of tyrosine kinase inhibitors, erlotinib and lapatinib, in serum-starved COS7 cells. (C) KD values of homodimerization for EGFR WT (the same data for NT in panel A), EGFRvIII, and EGFR L858R. The error bars represent the SEM at the single-cell level (n > 10). All the measurements were performed in a serum-free DMEM at 37 °C. *p < 0.05 (Student t test). (D) A scale mapping KD values of EGFR homodimerization under various molecular perturbations. The yellow and green dots indicate the perturbations to EGFR ECD and ICD, respectively, and a black dot indicates no perturbation. Each perturbation site is displayed in the illustration, representing the reaction of EGFR pre-homodimerization with log2 fold change values compared with the KD without perturbation. DMEM, Dulbecco's Modified Eagle Medium; ECD, extracellular domain; EGF, epidermal growth factor; EGFR, epidermal growth factor receptor; Fab, fragment antigen-binding; ICD, intracellular domain; NT, not treated; WT, wild type.
Fig 4
Fig 4. Comparison of equilibrium dissociation constants of EGFR and β2-AR homodimerization under ligand treatment and cholesterol sequestration.
KD values of EGFR and β2-AR homodimerizations were determined by Co-II under the existence of their ligands (EGF and ISO, respectively) and the sequestration of cholesterol in a plasma membrane. The scale mapping KD values for their homodimerizations are displayed for direct comparisons. β2-AR, beta-2 adrenergic receptor; EGF, epidermal growth factor; EGFR, epidermal growth factor receptor; ISO, isoproterenol; NT, not treated; SNAP, SNAP-tag.

Similar articles

Cited by

References

    1. Jennings ML. Topography of membrane proteins. Annu Rev Biochem. 1989;58:999–1027. 10.1146/annurev.bi.58.070189.005031 . - DOI - PubMed
    1. Sanders CR, Myers JK. Disease-related misassembly of membrane proteins. Annu Rev Biophys Biomol Struct. 2004;33:25–51. 10.1146/annurev.biophys.33.110502.140348 . - DOI - PubMed
    1. Santos R, Ursu O, Gaulton A, Bento AP, Donadi RS, Bologa CG, et al. A comprehensive map of molecular drug targets. Nat Rev Drug Discov. 2017;16(1):19–34. 10.1038/nrd.2016.230 . - DOI - PMC - PubMed
    1. Sydor A, Czymmek K, Puchner E, Mennella V. Super-Resolution Microscopy: From Single Molecules to Supramolecular Assemblies. Trends Cell Biol. 2015;25(12):730–748. 10.1016/j.tcb.2015.10.004 . - DOI - PubMed
    1. Berggard T, Linse S, James P. Methods for the detection and analysis of protein-protein interactions. Proteomics. 2007;7(16):2833–42. 10.1002/pmic.200700131 . - DOI - PubMed

Publication types

MeSH terms