

Bin-CE: A comprehensive web application to decide upon the best set of outcomes to be combined in a binary composite endpoint
- PMID: 30543676
- PMCID: PMC6292611
- DOI: 10.1371/journal.pone.0209000
Bin-CE: A comprehensive web application to decide upon the best set of outcomes to be combined in a binary composite endpoint
Abstract
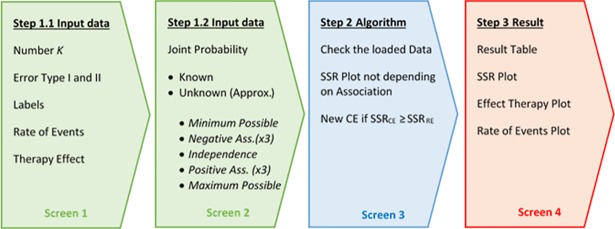
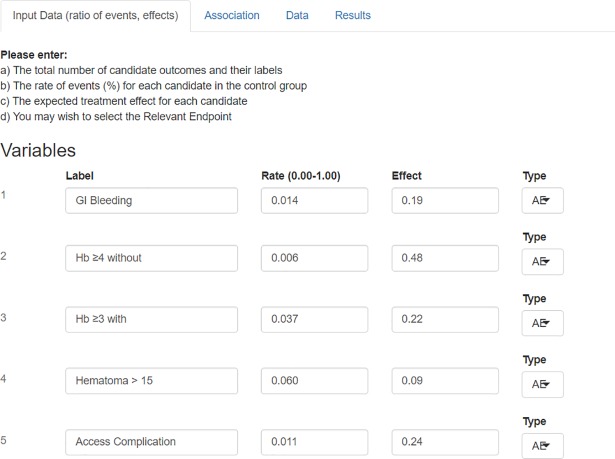
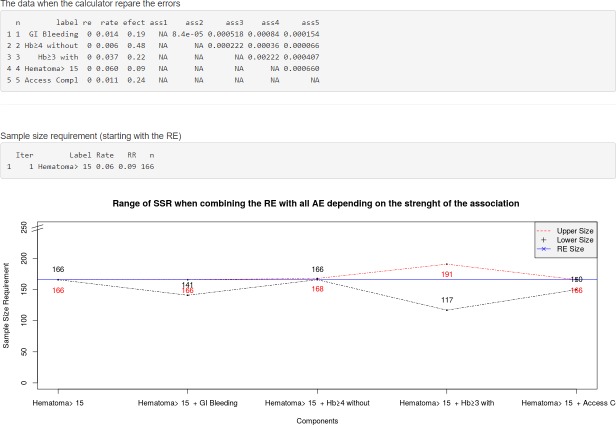
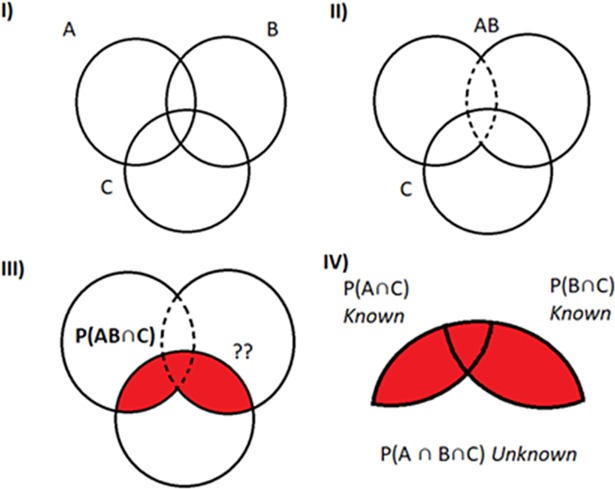
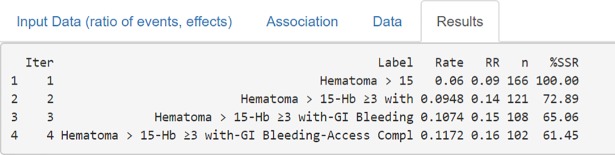
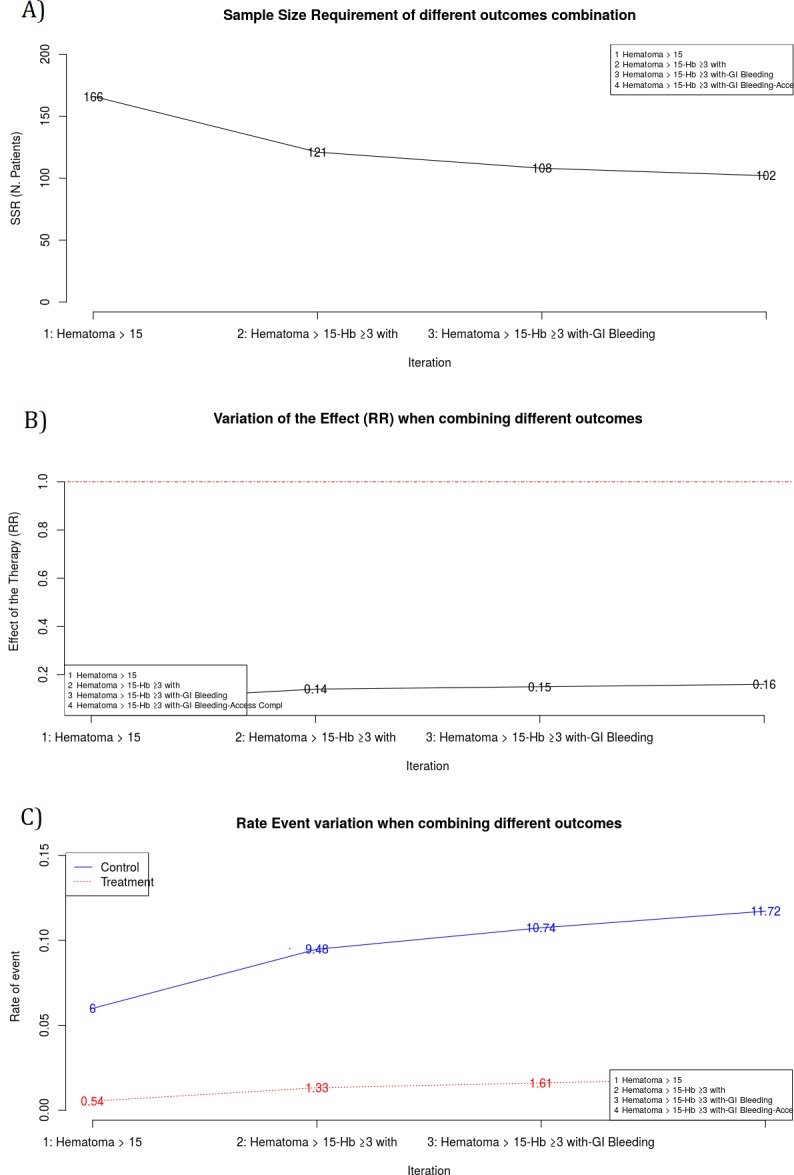
The estimation of the Sample Size Requirement (SSR) when using a binary composite endpoint (i.e. two or more outcomes combined in a unique primary endpoint) is not trivial. Besides information about the rate of events for each outcome, information about the strength of association between the outcomes is crucial, since it can determine an increase or decrease of the SSR. Specifically, the greater the strength of association between outcomes the higher the SSR. We present Bin-CE, a free tool to assist clinicians for computing the SSR for binary composite endpoints. In a first step, the user enters a set of candidate outcomes, the assumed rate of events for each outcome and the assumed effect of therapy on each outcome. Since the strength of the association between outcomes is usually unknown, a semi-parametric approach linking the a priori clinical knowledge of the potential degree of association between outcomes with the exact values of these parameters was programmed with Bin-CE. Bin-CE works with a recursive algorithm to choose the best combination of outcomes that minimizes the SSR. In addition, Bin-CE computes the sample size using different algorithms and shows different figures plotting the magnitude of the sample size reduction, and the effect of different combinations of outcomes on the rate of the primary endpoint. Finally, Bin-CE is programmed to perform sensitivity analyses. This manuscript presents the mathematic bases and introduces the reader to the use of Bin-CE using a real example.
Conflict of interest statement
The authors have declared that no competing interests exist.
Figures

Similar articles
-
The Use of a Binary Composite Endpoint and Sample Size Requirement: Influence of Endpoints Overlap.Am J Epidemiol. 2017 May 1;185(9):832-841. doi: 10.1093/aje/kww105. Am J Epidemiol. 2017. PMID: 28402501
-
Selection of composite binary endpoints in clinical trials.Biom J. 2018 Mar;60(2):246-261. doi: 10.1002/bimj.201600229. Epub 2017 Oct 12. Biom J. 2018. PMID: 29023990
-
A new approach for sizing trials with composite binary endpoints using anticipated marginal values and accounting for the correlation between components.Stat Med. 2019 May 20;38(11):1935-1956. doi: 10.1002/sim.8092. Epub 2019 Jan 13. Stat Med. 2019. PMID: 30637797
-
Composite endpoints.J Clin Epidemiol. 2020 Dec;128:157-158. doi: 10.1016/j.jclinepi.2020.07.017. Epub 2020 Jul 30. J Clin Epidemiol. 2020. PMID: 32739473 Review.
-
Design and analysis issues of multiregional clinical trials with different regional primary endpoints.J Biopharm Stat. 2012 Sep;22(5):1051-9. doi: 10.1080/10543406.2012.701586. J Biopharm Stat. 2012. PMID: 22946949 Review.
Cited by
-
Sample size requirement in trials that use the composite endpoint major adverse cardiovascular events (MACE): new insights.Trials. 2022 Dec 21;23(1):1037. doi: 10.1186/s13063-022-06977-4. Trials. 2022. PMID: 36539800 Free PMC article.
References
-
- Rauch G, Rauch B, Schüler S, Kieser M. Opportunities and challenges of clinical trials in cardiology using composite primary endpoints. World J Cardiol. 2015;7: 1–5. 10.4330/wjc.v7.i1.1 - DOI - PMC - PubMed
-
- Cordoba G, Schwartz L, Woloshin S, Bae H, Gøtzsche PC. Definition, reporting, and interpretation of composite outcomes in clinical trials: systematic review. BMJ. 2010;341: c3920 10.1136/bmj.c3920 - DOI - PMC - PubMed
-
- Ferreira-González I, Permanyer-Miralda G, Busse JW, Bryant DM, Montori VM, Alonso-Coello P, et al. Composite endpoints in clinical trials: the trees and the forest. J Clin Epidemiol. 2007;60: 660–661. 10.1016/j.jclinepi.2006.10.021 - DOI - PubMed
-
- Ferreira-González I, Busse JW, Heels-Ansdell D, Montori VM, Akl E a, Bryant DM, et al. Problems with use of composite end points in cardiovascular trials: systematic review of randomised controlled trials. BMJ. 2007;334: 786 10.1136/bmj.39136.682083.AE - DOI - PMC - PubMed
-
- Montori VM, Permanyer-Miralda G, Ferreira-González I, Busse JW, Pacheco-Huergo V, Bryant D, et al. Validity of composite end points in clinical trials. BMJ. 2005;330: 594–6. 10.1136/bmj.330.7491.594 - DOI - PMC - PubMed
MeSH terms
LinkOut - more resources
Full Text Sources
