. 2018 Dec 12;24(6):866-874.e4.
doi: 10.1016/j.chom.2018.11.005.

Septins Recognize and Entrap Dividing Bacterial Cells for Delivery to Lysosomes

Affiliations

Septins Recognize and Entrap Dividing Bacterial Cells for Delivery to Lysosomes

Sina Krokowski et al. Cell Host Microbe. .

Abstract

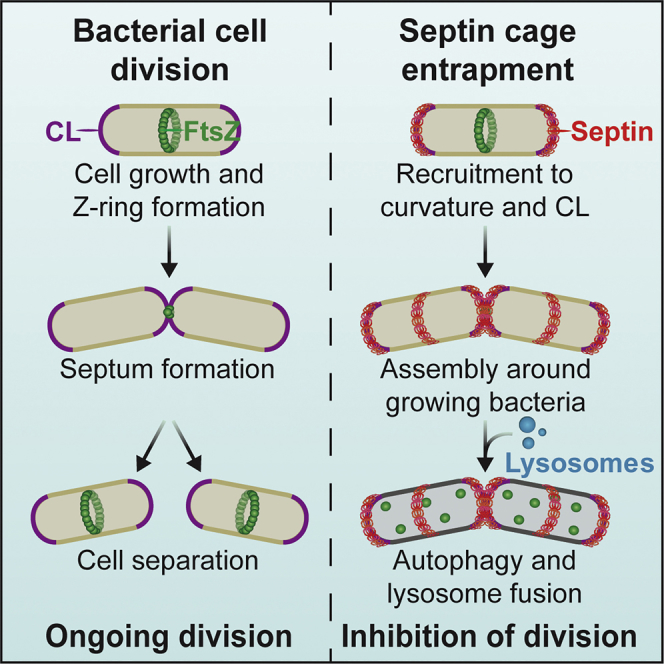
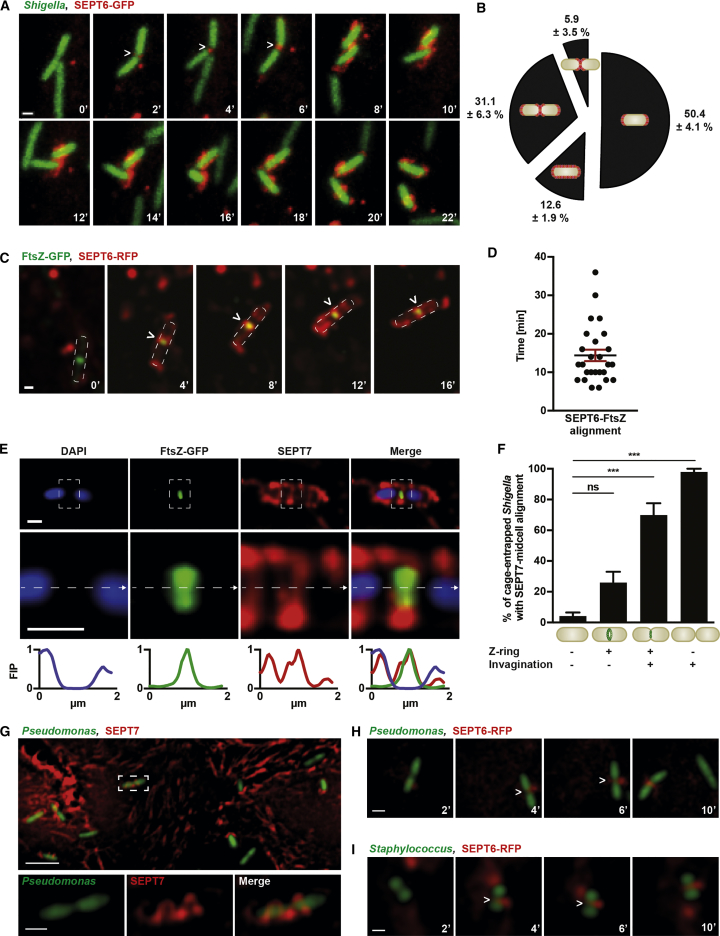
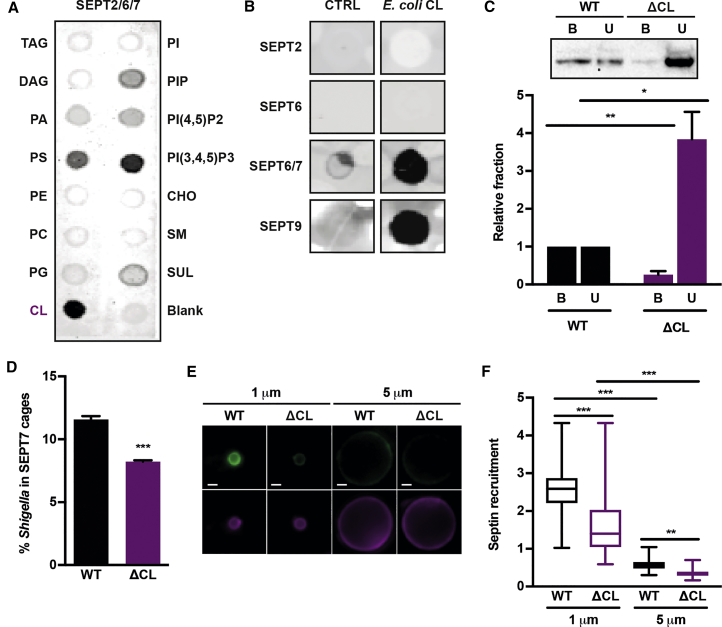
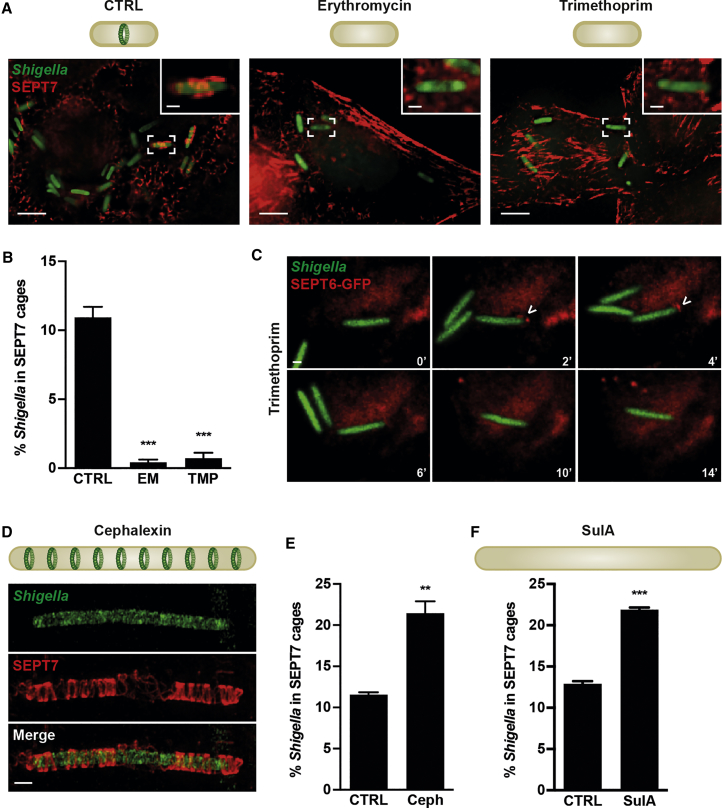
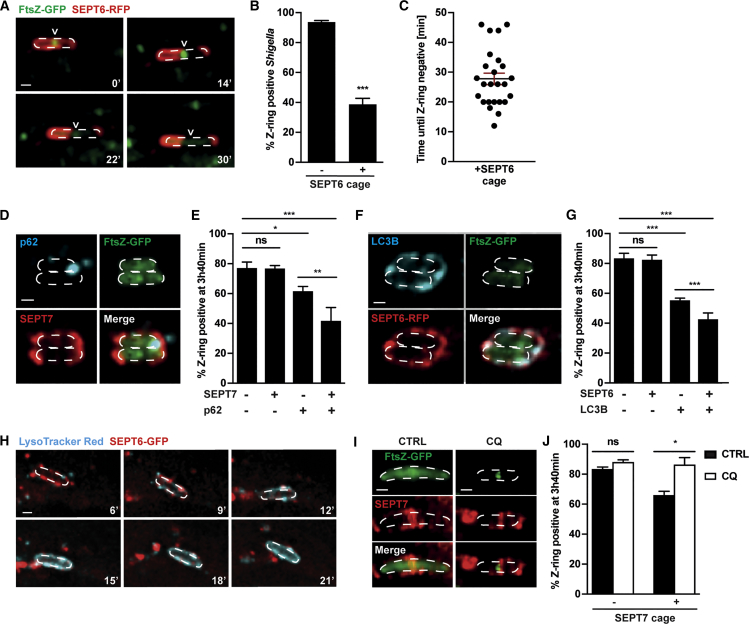
The cytoskeleton occupies a central role in cellular immunity by promoting bacterial sensing and antibacterial functions. Septins are cytoskeletal proteins implicated in various cellular processes, including cell division. Septins also assemble into cage-like structures that entrap cytosolic Shigella, yet how septins recognize bacteria is poorly understood. Here, we discover that septins are recruited to regions of micron-scale membrane curvature upon invasion and division by a variety of bacterial species. Cardiolipin, a curvature-specific phospholipid, promotes septin recruitment to highly curved membranes of Shigella, and bacterial mutants lacking cardiolipin exhibit less septin cage entrapment. Chemically inhibiting cell separation to prolong membrane curvature or reducing Shigella cell growth respectively increases and decreases septin cage formation. Once formed, septin cages inhibit Shigella cell division upon recruitment of autophagic and lysosomal machinery. Thus, recognition of dividing bacterial cells by the septin cytoskeleton is a powerful mechanism to restrict the proliferation of intracellular bacterial pathogens.

Keywords: FtsZ; Shigella; cardiolipin; cytoskeleton; membrane curvature; septins.


Figures

None
Graphical abstract
Figure 1
Figure 1
Septins Recognize Micron-Scale Bacterial Curvature (A) Time-lapse of S. flexneri mCherry-infected SEPT6-GFP HeLa at 2 hr 10 min post infection imaged every 2 min. White arrowheads indicate septin recruitment to the bacterial division site. Scale bar, 1 μm. See also Video S1. (B) Quantification of (A). The graph represents mean % ± SEM of septin recruitment to highly curved membrane areas (bacterial cell poles and/or bacterial midcell). Values from n = 79 bacterial cells from 8 independent experiments. (C) Time-lapse of S. flexneri FtsZ-GFP-infected SEPT6-RFP HeLa cells at 2 hr 10 min imaged every 2 min. White arrowheads indicate SEPT6-RFP overlap with FtsZ-GFP at the bacterial division site. Dashed lines indicate bacterial contour. Scale bar, 1 μm. (D) Quantification of (C). Graph shows individual times of SEPT6-FtsZ overlap from n = 26 bacterial cells including mean ± SEM from 6 independent experiments. (E) Representative SEPT7 cage in S. flexneri FtsZ-GFP-infected HeLa cells at 3 hr 40 min post infection. Scale bars, 1 μm. Inset images highlight a septin ring at the bacterial division site. Fluorescent intensity profile (FIP) was taken of the dotted line along the midline of the cell in the inset image and normalized from 0 to 1. (F) HeLa cells were infected for 3 hr 40 min with S. flexneri FtsZ-GFP and bacterial membrane was labeled with FM4-64X. Graph represents mean % ± SEM of SEPT7 aligning at midcell of entrapped S. flexneri when bacteria are either Z-ring negative and not invaginated (−, −), Z-ring positive and not invaginated (+, −), Z-ring positive and invaginated (+, +), or Z-ring negative after cell separation (−, +). Values from n = 289 bacterial cells from 3 independent experiments. One-way ANOVA; ns, p > 0.05; ∗∗∗p < 0.001. (G) P. aeruginosa GFP-infected HeLa cells at 4 hr post infection immunostained for SEPT7. Scale bars, 5 μm (main image) and 1 μm (inset). (H) Time-lapse of P. aeruginosa GFP-infected SEPT6-RFP HeLa cells at 1 hr post infection imaged every 2 min. Scale bar, 1 μm. See also Video S2. (I) Time-lapse of S. aureus GFP-infected SEPT6-RFP HeLa cells at 1 hr post infection imaged every 2 min. Scale bar, 1 μm. See also Video S3. See also Figure S1.
Figure 2
Figure 2
Cardiolipin Promotes Septin Recruitment to Shigella Membrane Curvature (A) Membrane lipid strips were incubated with 200 nM SEPT2/6/7. TAG, triacylglycerol; DAG, diacylglycerol; PA, phosphatidic acid; PS, phosphatidylserine; PE, phosphatidylethanolamine; PC, phosphatidylcholine; PG, phosphatidylglycerol; CL, cardiolipin; PI, phosphatidylinositol; PIP, phosphatidylinositol phosphate; PI(4,5)P2, phosphatidylinositol bisphosphate; PI(3,4,5)P3, phosphatidylinositol trisphosphate; CHO, cholesterol; SM, sphingomyelin; SUL, sulfatide. (B) Representative lipid dot blot in which 200 nM SEPT2, SEPT6 (negative control because no lipid interaction [Spiliotis, 2018]), SEPT6/7, or SEPT9 was incubated with a nitrocellulose membrane containing water (CTRL) or 10 nmol purified CL from E. coli (E. coli CL). (C) SEPT2/6/7 was incubated with liposomes made from S. flexneri wild-type (WT) or ΔCL and centrifuged on a sucrose gradient. Representative western blot (top) shows equal volumes for the top fraction (B, liposome-bound SEPT2/6/7) and bottom fraction (U, unbound SEPT2/6/7). Bar graph shows mean ± SEM of the amount of SEPT2/6/7 in the bound (B) and unbound (U) fraction relative to liposomes made from WT from 3 independent experiments. Student's t test, ∗∗p < 0.01, p < 0.05. (D) Graph represents mean % ± SEM of SEPT7 cage-entrapped S. flexneri WT or ΔCL at 3 hr 40 min post infection. Values from n = 4,945 bacterial cells from 3 independent experiments. Student's t test, ∗∗∗p < 0.001. (E) Representative image of 50 nM SEPT2/6/7 labeled with NHS-Alexa Fluor 488 (green) recruitment to 1-μm or 5-μm silica beads coated in lipid bilayer from Sflexneri WT or ΔCL containing RhPE (purple). Scale bar, 1 μm. (F) Quantification of (E). Graph shows median and whiskers (min to max) from n ≥ 243 beads for each condition from 3 independent experiments. Kruskal-Wallis test, ∗∗∗p < 0.001, ∗∗p < 0.01. See also Figure S2.
Figure 3
Figure 3
Septin Cages Entrap Actively Dividing Bacteria (A) Diagrams illustrate that untreated bacteria (CTRL) assemble a Z-ring at bacterial midcell and erythromycin (EM) and trimethoprim (TMP) inhibit bacterial cell division and Z-ring assembly. Untreated (CTRL), EM-treated, or TMP-treated S. flexneri x-light GFP-infected HeLa cells at 3 hr 40 min post infection. Scale bars, 5 μm (main image) and 1 μm (inset). (B) Quantification of (A). Graph shows mean % ± SEM of S. flexneri entrapped in SEPT7 cages in CTRL, EM-treated, or TMP-treated cells. Values from n = 5,215 bacterial cells from 3 independent experiments. Student's t test, ∗∗∗p < 0.001. (C) HeLa SEPT6-GFP cells were infected with Shigella mCherry, treated with TMP for 2 hr, and imaged every 2 min. Video frames (representative for n = 76 bacterial cells from 3 independent experiments) show temporary septin recruitment to the pole but no assembly into septin cages. Scale bar, 1 μm. (D) Diagram illustrates cephalexin-treated bacterium, which elongates and forms division sites (i.e., FtsZ positive). SIM image of SEPT7 cage around cephalexin-treated S. flexneri GFP at 3 hr 40 min inside HeLa cell. Scale bar, 1 μm. (E) Graph represents mean % ± SEM of S. flexneri entrapped in SEPT7 cage-like structures in untreated (CTRL) or cephalexin-treated (Ceph) cells. Values from n = 2,487 bacterial cells for CTRL and n = 499 bacterial cells from Ceph samples from 3 independent experiments. Student's t test, ∗∗p < 0.01. (F) Diagram illustrates that overproduction of SulA inhibits Z-ring formation leading to cell filamentation. Graph shows mean % ± SEM of S. flexneri entrapped in SEPT7 cage-like structures in untreated (CTRL) or SulA-overproduced (SulA) samples. Values from n = 3,693 bacterial cells from 3 independent experiments. Student's t test, ∗∗∗p < 0.001. See also Figure S3.
Figure 4
Figure 4
Septin Cages Inhibit Bacterial Cell Division via Autophagy and Lysosome Fusion (A) Time-lapse of S. flexneri FtsZ-GFP-infected SEPT6-RFP HeLa cells at 2 hr 10 min post infection imaged every 4 min showing late stages of septin cage. Arrowheads point to the progressive disassembly of the Z-ring inside the bacterium (dashed outline). Scale bar, 1 μm. (B) Quantification of (A). Graph shows mean % ± SEM of non-entrapped S. flexneri (-SEPT6 cage) or septin cage-entrapped S. flexneri (+SEPT6 cage) becoming Z-ring negative during imaging. Values from n = 1,721 bacterial cells from 8 independent experiments. Only bacteria that were entrapped for at least 3 consecutive time frames were considered as SEPT6 cage entrapped. Student's t test, ∗∗∗p < 0.001. (C) Quantification of (A). Graph shows the time from SEPT6 cage entrapment until Z-ring disassembly including mean ± SEM from n = 25 bacterial cells from 6 independent experiments. Only videos starting with septin recruitment and ending with Z-ring disassembly were considered for this quantification. (D–G) S. flexneri FtsZ-GFP-infected HeLa cells at 3 hr 40 min post infection. Image shows two SEPT7 (D) or SEPT6 (F) cages positive for p62 (D) or LC3B (F) entrapping Z ring negative bacteria. Scale bar, 1 μm. Graphs show mean % ± SEM of Z-ring-positive bacteria (E and G). Values from n = 3,292 (E) or n = 1,737 (G) bacterial cells from 4 independent experiments Student's t test, ns, p > 0.5; ∗∗∗p < 0.001. (H) Time-lapse of S. flexneri-infected, LysoTracker red-labeled SEPT6-GFP HeLa cells at 2 hr 10 min imaged every 3 min. Frames show late stages of septin cage-entrapped Shigella (dashed outline). Scale bar, 1 μm. (I) SEPT7 cages in S. flexneri FtsZ-GFP-infected untreated (CTRL) or chloroquine-treated (CQ) HeLa cells at 3 hr 40 min. Scale bar, 1 μm. (J) Quantification of (I). Graph shows mean % ± SEM of Z-ring-positive S. flexneri outside septin cages (−SEPT7 cage) and inside septin cages (+SEPT7 cage) in CTRL or CQ-treated cells. Values from n = 5,047 bacterial cells from 3 independent experiments. Student's t test, ns, p > 0.5; p < 0.05. See also Figure S4.

Comment in

References

    1. Bai X., Bowen J.R., Knox T.K., Zhou K., Pendziwiat M., Kuhlenbäumer G., Sindelar C.V., Spiliotis E.T. Novel septin 9 repeat motifs altered in neuralgic amyotrophy bind and bundle microtubules. J. Cell Biol. 2013;203:895–905. - PMC - PubMed
    1. Bi E., Lutkenhaus J. FtsZ ring structure associated with division in Escherichia coli. Nature. 1991;354:161–164. - PubMed
    1. Bridges A.A., Jentzsch M.S., Oakes P.W., Occhipinti P., Gladfelter A.S. Micron-scale plasma membrane curvature is recognized by the septin cytoskeleton. J. Cell Biol. 2016;213:23–32. - PMC - PubMed
    1. Cannon K.S., Woods B.L., Gladfelter A.S. The unsolved problem of how cells sense micron-scale curvature. Trends Biochem. Sci. 2017;42:961–976. - PMC - PubMed
    1. Cherepanov P.P., Wackernagel W. Gene disruption in Escherichia coli: TcR and KmR cassettes with the option of Flp-catalyzed excision of the antibiotic-resistance determinant. Gene. 1995;158:9–14. - PubMed

Publication types

MeSH terms