Racial-Ethnic Differences in Osteoarthritis Pain and Disability: A Meta-Analysis
- PMID: 30543951
- PMCID: PMC6557704
- DOI: 10.1016/j.jpain.2018.11.012
Racial-Ethnic Differences in Osteoarthritis Pain and Disability: A Meta-Analysis
Abstract
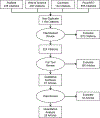
Osteoarthritis (OA), a leading cause of disability and pain, affects 32.5 million Americans, producing tremendous economic burden. Although some findings suggest that racial/ethnic minorities experience increased OA pain severity, other studies have shown conflicting results. This meta-analysis examined differences in clinical pain severity between African Americans (AAs) and non-Hispanic whites with OA. Articles were initially identified between October 1 and 5, 2016, and updated May 30, 2018, using PubMed, Web of Science, PsycINFO, and the Cochrane Library Database. Eligibility included English-language peer-reviewed articles comparing clinical pain severity in adult black/AA and non-Hispanic white/Caucasian patients with OA. Nonduplicate article abstracts (N = 1,194) were screened by 4 reviewers, 224 articles underwent full-text review, and 61 articles reported effect sizes of pain severity stratified by race. Forest plots of the standard mean difference showed higher pain severity in AAs for studies using the Western Ontario and McMasters Universities Osteoarthritis Index (0.57; 95% confidence interval [CI], 0.54-0.61) and non-Western Ontario and McMasters Universities Osteoarthritis Index studies (0.35, 95% CI, 0.23-0.47). AAs also showed higher self-reported disability (0.38, 95% CI, 0.22-0.54) and poorer performance testing (-0.58, 95% CI, -0.72 to -0.44). Clinical pain severity and disability in OA is higher among AAs and future studies should explore the reasons for these differences to improve pain management. PERSPECTIVE: This meta-analysis shows that differences exist in clinical pain severity, functional limitations, and poor performance between AAs and non-Hispanic whites with OA. This research may lead to a better understanding of racial/ethnic differences in OA-related pain.
Keywords: Disability; Meta-analysis; Osteoarthritis; Pain; Race/ethnicity.
Copyright © 2019. Published by Elsevier Inc.
Conflict of interest statement
The authors declare no conflicts of interest.
Figures


Similar articles
-
Movement-evoked pain, physical function, and perceived stress: An observational study of ethnic/racial differences in aging non-Hispanic Blacks and non-Hispanic Whites with knee osteoarthritis.Exp Gerontol. 2019 Sep;124:110622. doi: 10.1016/j.exger.2019.05.011. Epub 2019 May 30. Exp Gerontol. 2019. PMID: 31154005 Free PMC article.
-
Racial and ethnic differences in older adults with knee osteoarthritis.Arthritis Rheumatol. 2014 Jul;66(7):1800-10. doi: 10.1002/art.38620. Arthritis Rheumatol. 2014. PMID: 24729357 Free PMC article.
-
Natural history of pain and disability among African-Americans and Whites with or at risk for knee osteoarthritis: A longitudinal study.Osteoarthritis Cartilage. 2018 Apr;26(4):471-479. doi: 10.1016/j.joca.2018.01.020. Epub 2018 Feb 2. Osteoarthritis Cartilage. 2018. PMID: 29408279 Free PMC article.
-
Racial Disparities in Arterial Stiffness Between Healthy Whites and African Americans in the United States: A Meta-analysis.J Natl Med Assoc. 2019 Feb;111(1):7-17. doi: 10.1016/j.jnma.2018.06.001. Epub 2018 Jul 4. J Natl Med Assoc. 2019. PMID: 30129482 Free PMC article.
-
Racial and ethnic differences in the pharmacologic management of osteoarthritis: rapid systematic review.Ther Adv Musculoskelet Dis. 2022 Jun 30;14:1759720X221105011. doi: 10.1177/1759720X221105011. eCollection 2022. Ther Adv Musculoskelet Dis. 2022. PMID: 35794906 Free PMC article. Review.
Cited by
-
Associations of pain catastrophizing with pain-related brain structure in individuals with or at risk for knee osteoarthritis: Sociodemographic considerations.Brain Imaging Behav. 2021 Aug;15(4):1769-1777. doi: 10.1007/s11682-020-00372-w. Brain Imaging Behav. 2021. PMID: 33095381 Free PMC article.
-
Disease-Specific Health Disparities: A Targeted Review Focusing on Race and Ethnicity.Healthcare (Basel). 2022 Mar 23;10(4):603. doi: 10.3390/healthcare10040603. Healthcare (Basel). 2022. PMID: 35455781 Free PMC article. Review.
-
Everyday Discrimination in Adults with Knee Pain: The Role of Perceived Stress and Pain Catastrophizing.J Pain Res. 2020 May 1;13:883-895. doi: 10.2147/JPR.S235632. eCollection 2020. J Pain Res. 2020. PMID: 32431537 Free PMC article.
-
Epidemiology of osteoarthritis: literature update 2022-2023.Curr Opin Rheumatol. 2024 Mar 1;36(2):108-112. doi: 10.1097/BOR.0000000000000985. Epub 2023 Oct 19. Curr Opin Rheumatol. 2024. PMID: 38240280 Free PMC article. Review.
-
Racial Disparities in Total Knee and Hip Arthroplasty in a Medically Underserved Community with a Diverse Population.J Racial Ethn Health Disparities. 2025 Feb;12(1):513-519. doi: 10.1007/s40615-023-01891-0. Epub 2023 Dec 12. J Racial Ethn Health Disparities. 2025. PMID: 38085463
References
Publication types
MeSH terms
Grants and funding
LinkOut - more resources
Full Text Sources
Medical

