

Survival nomograms for stage III colorectal cancer
- PMID: 30544384
- PMCID: PMC6310595
- DOI: 10.1097/MD.0000000000013239
Survival nomograms for stage III colorectal cancer
Abstract
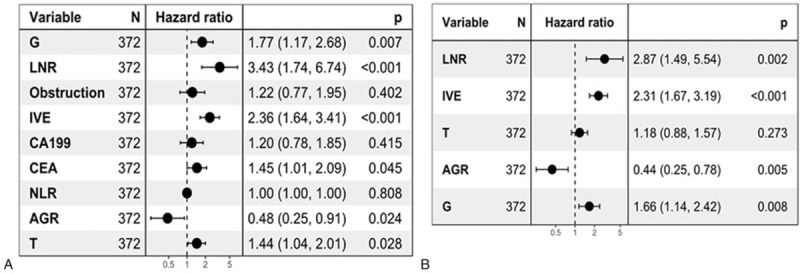
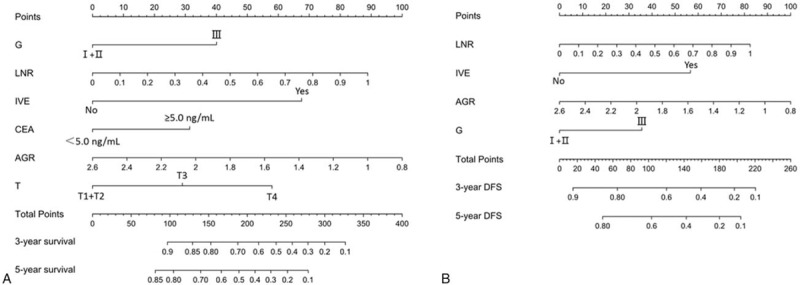
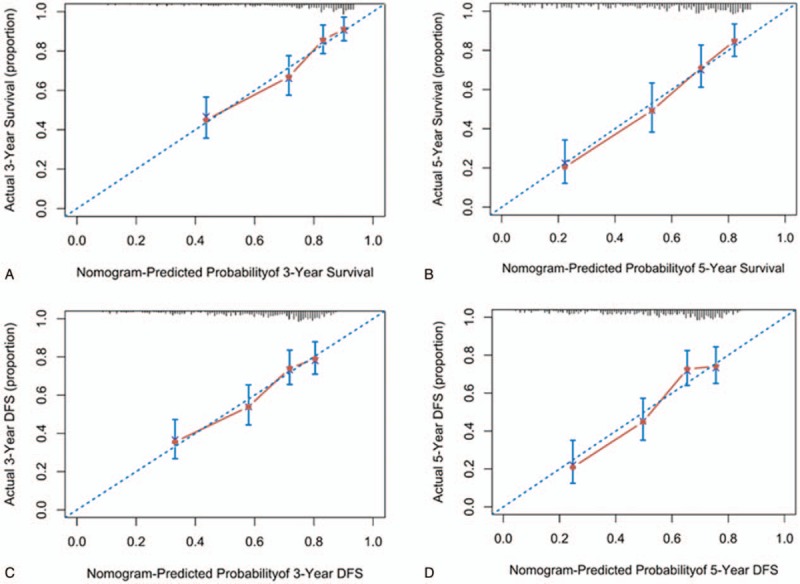
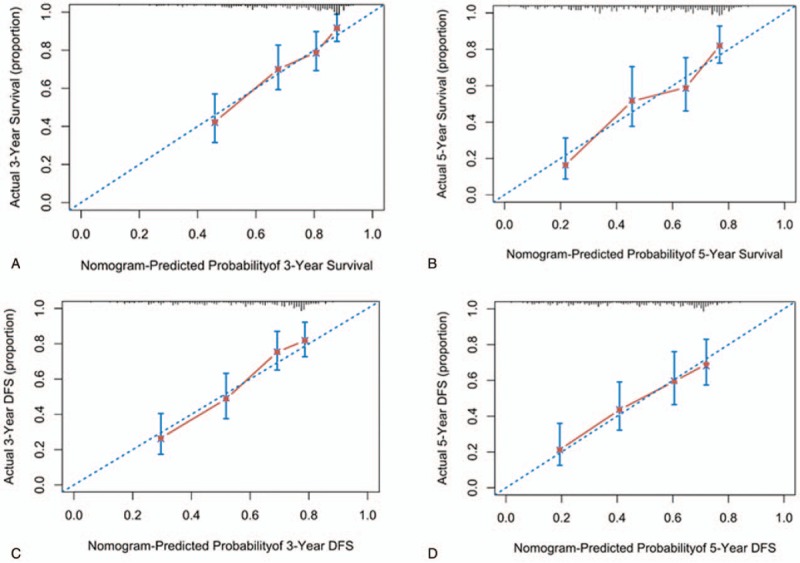
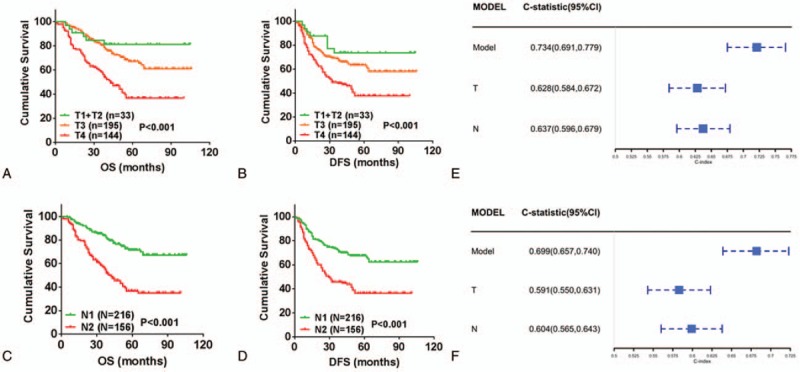
The postoperative survival of patients with stage III colorectal cancer (CRC) various obviously. We sought to develop novel nomograms for predicting the survival of these patients after radical surgery and postoperative chemotherapy.A total of 620 consecutive patients with stage III CRC who underwent curative resection and postoperative chemotherapy between January 2009 and December 2015 were retrospectively collected and randomly allocated to the training (n = 372) or validation cohort (n = 248). Clinicopathological factors were collected and analyzed. On the basis of data from 372 patients in the training set, predictive factors for overall survival (OS) and disease-free survival (DFS) were identified using multivariate Cox regression and used to construct nomograms. The predictive performance of the nomograms was assessed by concordance index (C-index) and calibration plots. An external cohort of 248 patients was used to validate the nomograms. Furthermore, nomogram performance was compared with the performance of T and N stage stratification.Tumor differentiation grade, lymph node metastasis ratio, intravascular emboli (IVE), preoperative serum carcinoembryonic antigen (CEA) level, albumin to globulin ratio (AGR), T stage and N stage were significant prognostic factors for OS on multivariate analysis; whereas, Tumor differentiation grade, lymph node metastasis ratio, IVE, AGR and N stage were significant for DFS. Nomograms to predict 3- and 5-year OS and DFS were established that performed well (C-indexes of 0.734 [95% CI, 0.691-0.779] for OS and 0.699 [95% CI, 0.657-0.740] for DFS prediction), and nomogram accuracy was confirmed in the validation cohort. Furthermore, model comparison proved that the nomograms were superior to risk stratification by T and N stage for stage III CRC.We propose 2 practical nomograms for stage III CRC patients that provide more accurate prognostic predictions and should be helpful for guiding individualized treatment and postoperative surveillance.
Conflict of interest statement
The authors have no conflicts of interest to disclose.
Figures
References
-
- Siegel RL, Miller KD, Jemal A. Cancer statistics, 2016. CA Cancer J Clin 2016;66:7–30. - PubMed
-
- Chen W, Zheng R, Baade PD, et al. Cancer statistics in China, 2015. CA Cancer J Clin 2016;66:115–32. - PubMed
-
- Webber C, Gospodarowicz M, Sobin LH, et al. Improving the TNM classification: findings from a 10-year continuous literature review. Int J Cancer 2014;135:371–8. - PubMed
Publication types
MeSH terms
Substances
LinkOut - more resources
Full Text Sources
Medical
