LeNRT1.1 Improves Nitrate Uptake in Grafted Tomato Plants under High Nitrogen Demand
- PMID: 30544504
- PMCID: PMC6321218
- DOI: 10.3390/ijms19123921
LeNRT1.1 Improves Nitrate Uptake in Grafted Tomato Plants under High Nitrogen Demand
Abstract
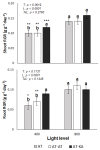
Grafting has become a common practice among tomato growers to obtain vigorous plants. These plants present a substantial increase in nitrogen (N) uptake from the root zone. However, the mechanisms involved in this higher uptake capacity have not been investigated. To elucidate whether the increase in N uptake in grafted tomato plants under high N demand conditions is related to the functioning of low- (high capacity) or high-affinity (low capacity) root plasma membrane transporters, a series of experiments were conducted. Plants grafted onto a vigorous rootstock, as well as ungrafted and homograft plants, were exposed to two radiation levels (400 and 800 µmol m-2 s-1). We assessed root plasma membrane nitrate transporters (LeNRT1.1, LeNRT1.2, LeNRT2.1, LeNRT2.2 and LeNRT2.3) expression, Michaelis‒Menten kinetics parameters (Vmax and Km), root and leaf nitrate reductase activity, and root respiration rates. The majority of nitrate uptake is mediated by LeNRT1.1 and LeNRT1.2 in grafted and ungrafted plants. Under high N demand conditions, vigorous rootstocks show similar levels of expression for LeNRT1.1 and LeNRT1.2, whereas ungrafted plants present a higher expression of LeNRT1.2. No differences in the uptake capacity (evaluated as Vmax), root respiration rates, or root nitrate assimilation capacity were found among treatments.
Keywords: growth rate; nitrate transporters expression; root membrane transporters; root respiration.
Conflict of interest statement
The authors declare no conflict of interest.
Figures


Similar articles
-
Preferential expression of an ammonium transporter and of two putative nitrate transporters in root hairs of tomato.Proc Natl Acad Sci U S A. 1996 Jul 23;93(15):8139-44. doi: 10.1073/pnas.93.15.8139. Proc Natl Acad Sci U S A. 1996. PMID: 8755617 Free PMC article.
-
LeNRT2.3 functions in nitrate acquisition and long-distance transport in tomato.FEBS Lett. 2015 Apr 28;589(10):1072-9. doi: 10.1016/j.febslet.2015.03.016. Epub 2015 Mar 24. FEBS Lett. 2015. PMID: 25819437
-
Genotypic differences in nitrate uptake, translocation and assimilation of two Chinese cabbage cultivars [Brassica campestris L. ssp. Chinensis (L.)].Plant Physiol Biochem. 2013 Sep;70:14-20. doi: 10.1016/j.plaphy.2013.04.027. Epub 2013 May 17. Plant Physiol Biochem. 2013. PMID: 23770590
-
Uptake, allocation and signaling of nitrate.Trends Plant Sci. 2012 Aug;17(8):458-67. doi: 10.1016/j.tplants.2012.04.006. Epub 2012 May 31. Trends Plant Sci. 2012. PMID: 22658680 Review.
-
The Expected and Unexpected Roles of Nitrate Transporters in Plant Abiotic Stress Resistance and Their Regulation.Int J Mol Sci. 2018 Nov 9;19(11):3535. doi: 10.3390/ijms19113535. Int J Mol Sci. 2018. PMID: 30423982 Free PMC article. Review.
Cited by
-
Comparative analysis of primary metabolites and transcriptome changes between ungrafted and pumpkin-grafted watermelon during fruit development.PeerJ. 2020 Jan 6;8:e8259. doi: 10.7717/peerj.8259. eCollection 2020. PeerJ. 2020. PMID: 31934503 Free PMC article.
-
Integration of GWAS and transcriptome approaches for the identification of nitrogen-, phosphorus-, and potassium-responsive genes in tomato.Hortic Res. 2025 Apr 24;12(7):uhaf112. doi: 10.1093/hr/uhaf112. eCollection 2025 Jul. Hortic Res. 2025. PMID: 40620696 Free PMC article.
-
A systematic assessment of how rootstock growth characteristics impact grafted tomato plant biomass, resource partitioning, yield, and fruit mineral composition.Front Plant Sci. 2022 Dec 15;13:948656. doi: 10.3389/fpls.2022.948656. eCollection 2022. Front Plant Sci. 2022. PMID: 36589098 Free PMC article.
-
Overlapping Root Architecture and Gene Expression of Nitrogen Transporters for Nitrogen Acquisition of Tomato Plants Colonized with Isolates of Funneliformis mosseae in Hydroponic Production.Plants (Basel). 2022 Apr 27;11(9):1176. doi: 10.3390/plants11091176. Plants (Basel). 2022. PMID: 35567176 Free PMC article.
-
Effect of Self- and Inter-Cultivar Grafting on Growth and Nutrient Content in Sweet Basil (Ocimum basilicum L.).Front Plant Sci. 2022 Jul 22;13:921440. doi: 10.3389/fpls.2022.921440. eCollection 2022. Front Plant Sci. 2022. PMID: 35958205 Free PMC article.
References
-
- Singh H., Kumar P., Chaudhari S., Edelstein M. Tomato grafting: A global perspective. HortScience. 2017;52:1328–1336. doi: 10.21273/HORTSCI11996-17. - DOI
-
- Lee J., Kubota C., Tsao S.J., Bie Z., Hoyos Echevarria P., Morra L., Oda M. Current status of vegetable grafting: Diffusion, grafting techniques, automation. Sci. Hortic. 2010;127:93–105. doi: 10.1016/j.scienta.2010.08.003. - DOI
-
- Djidonou D., Zhao X., Simonne E.H., Koch K.E., Erickson J.E. Yield, water-, and nitrogen-use efficiency in field-grown, grafted tomatoes. HortScience. 2013;48:485–492.
-
- Magalhaes J.S., Wilcox G.E. Tomato growth and nutrient uptake patterns as influenced by nitrogen form and light intensity. J. Plant Nutr. 1983;6:941–956. doi: 10.1080/01904168309363157. - DOI
-
- Errebhi M., Wilcox G.E. Tomato growth and nutrient uptake pattern as influenced by nitrogen form ratio. J. Plant Nutr. 1990;18:1031–1043. doi: 10.1080/01904169009364133. - DOI
MeSH terms
Substances
Grants and funding
LinkOut - more resources
Full Text Sources

