. 2018 Dec 7;10(12):1946.
doi: 10.3390/nu10121946.

Botanical Formulation HX109 Ameliorates TP-Induced Benign Prostate Hyperplasia in Rat Model and Inhibits Androgen Receptor Signaling by Upregulating Ca2+/CaMKKβ and ATF3 in LNCaP Cells

Affiliations

Botanical Formulation HX109 Ameliorates TP-Induced Benign Prostate Hyperplasia in Rat Model and Inhibits Androgen Receptor Signaling by Upregulating Ca2+/CaMKKβ and ATF3 in LNCaP Cells

Seonung Lim et al. Nutrients. .

Abstract

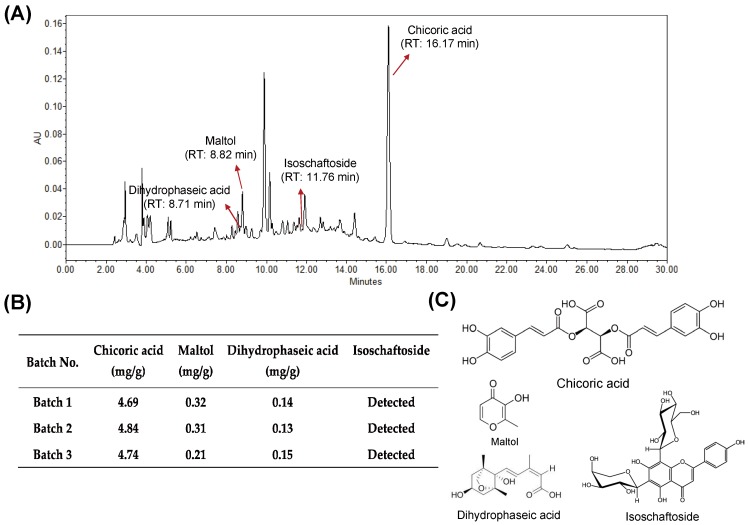
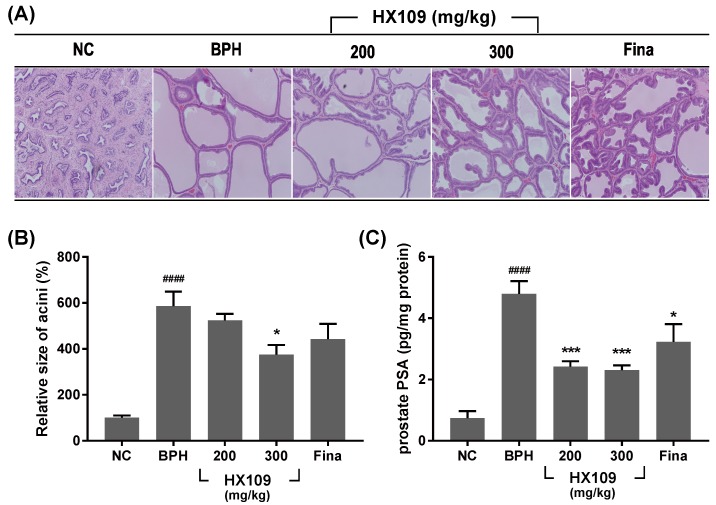
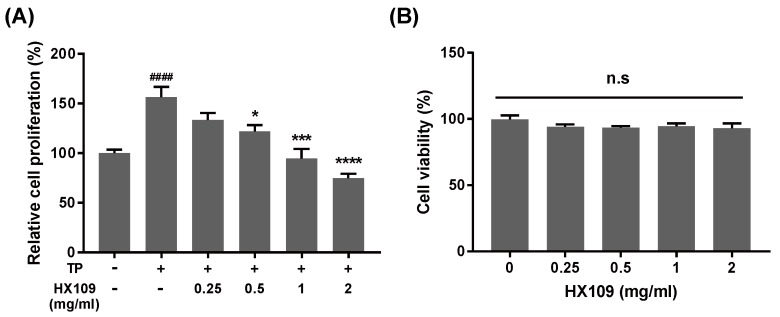
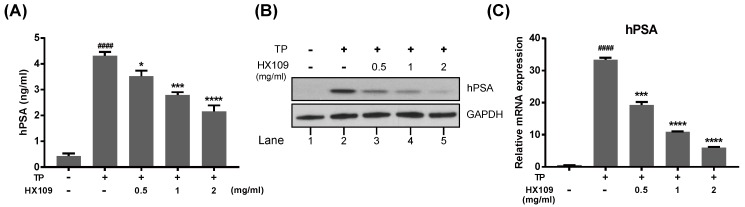
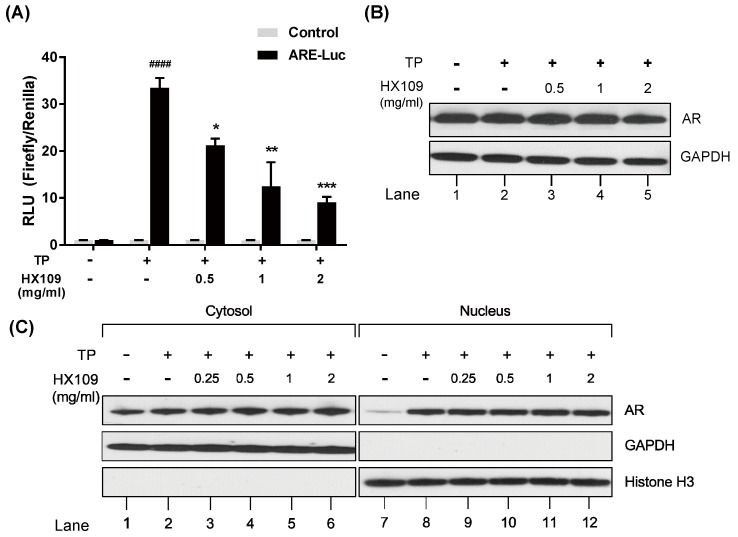
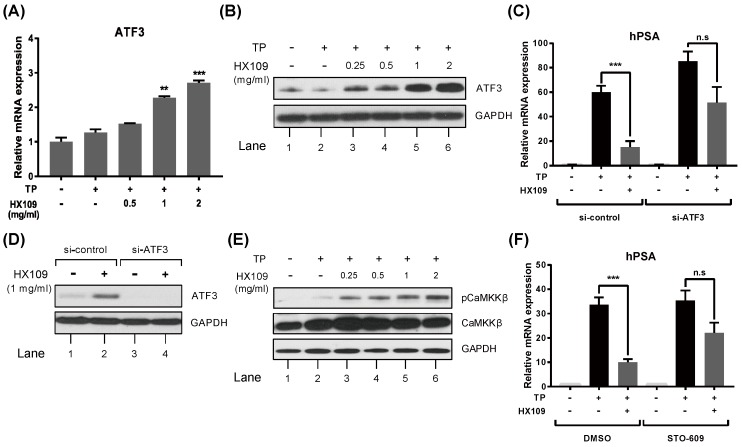
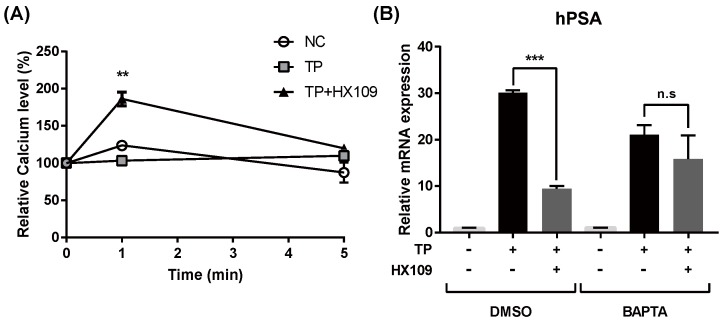
Benign prostatic hyperplasia (BPH) is a common disease in the elderly male population throughout the world. Among other factors, androgen dysregulation has been known to play major roles in its pathogenesis. HX109 is a botanical formulation prepared from a mixture of Taraxacum officinale, Cuscuta australis, and Nelumbo nucifera, which have traditionally been used-usually along with other plants-to treat urinary diseases. An ethanol extract was prepared from a mixture of these three plants, and its quality was controlled through cell-based bioassays and by quantification of several marker compounds by high-performance liquid chromatography (HPLC). In the testosterone propionate (TP)-induced prostate hyperplasia rat model, oral administration of HX109 ameliorated prostate enlargement and histological changes induced by TP. In LNCaP cells, a human prostate epithelial cell line, HX109 repressed AR-mediated cell proliferation and the induction of androgen receptor (AR) target genes at the transcriptional level without affecting the translocation or expression of AR. Such effects of HX109 on AR signaling were mediated through the control of activating transcriptional factor 3 (ATF3) expression, phosphorylation of calcium/calmodulin-dependent protein kinase kinase β (CaMKKβ), and increases in intracellular calcium, as evidenced by data from experiments involving ATF3-specific siRNA, CaMKKβ inhibitor, and calcium chelator, respectively. Taken together, our data suggest that HX109 might be used as a starting point for developing therapeutic agents for the treatment of BPH.

Keywords: AR signaling; ATF3; BPH; CaMKKβ; HX109.


Conflict of interest statement

W.L., D.S.L., I.-J.N., N.Y., Y.J., and S.K. are the employees of ViroMed Co. Ltd. S.K. owns stocks of this company. Other authors have no conflict of interest.

Figures

Figure 1
Figure 1
Preparation of HX109 was standardized using marker compounds. HX109 was dissolved in 50% methanol at a concentration of 20 mg/mL and subjected to HPLC analysis. (A) Representative HPLC chromatogram of HX109. HPLC was performed as described in the Materials and Methods section. The marker compounds in HX109 were identified by comparison with the reference standard and the peaks of marker compounds are indicated by arrows. RT, retention time. (B) Quantification of marker compounds in HX109. (C) Molecular structure of marker compounds.
Figure 2
Figure 2
HX109 repressed TP-induced enlargement of prostate and PSA expression in rat prostate. Castrated Sprague Dawley rats were injected with 3 mg/kg every three days and orally administrated with TDW (BPH) or 200 mg/kg of HX109 or 300 mg/kg of HX109 or 5 mg/kg of finasteride (Fina). Rats injected with vehicle were used as a negative control (NC) group. (A) Effects of HX109 on histological changes in prostate. After measuring the final prostate weight, rats were sacrificed and prostate tissues were fixed, sectioned, and stained with hematoxylin and eosin (H&E). (B) Relative size of acinal area. Values were calculated from three randomly captured pictures. #### p < 0.0001 (one-way ANOVA) compared with the NC group, * p < 0.05 (one-way ANOVA) compared with the BPH group. All data are shown as mean ± S.E.M. (C) Effects of HX109 on prostate PSA levels. PSA levels of rat prostate were measured by ELISA. Values were normalized to total proteins. n = 5 per group. #### p < 0.0001 (one-way ANOVA) compared with the NC group, * p < 0.05, *** p < 0.001 (one-way ANOVA) compared with BPH group. All data are shown as mean ± S.E.M.
Figure 3
Figure 3
HX109 suppressed androgen-dependent proliferation of LNCaP cells. LNCaP cells were plated in culture media for 24 h followed by androgen starvation using phenol red free RPMI 1640 containing 10% charcoal-stripped serum for 24 h. After androgen starvation, LNCaP cells were treated with or without 100 nM TP and cultured in the presence of various concentrations of HX109 for 72 h. Cell proliferation was measured by WST-1 assay. (A) Effects of HX109 on the TP-induced proliferation of LNCaP cells. (B) Cytotoxicity effects of HX109. #### p < 0.0001 (one-way ANOVA) compared with control, * p < 0.05, *** p < 0.001, **** p < 0.0001 (one-way ANOVA) compared with TP only. n.s, not significant. Values are normalized to control. All data are shown as mean ± S.E.M. of three independent experiments. ‘+’ means ‘treated with TP or HX109’, if it is on the right side of TP, it means ‘treated with TP’; if it is on the right side of HX109, it means ’treated with HX109’. ‘−’ means ‘not treated with TP or HX109’.
Figure 4
Figure 4
HX109 inhibited the androgen-induced PSA (KLK3) expression in LNCaP cells. LNCaP cells were treated as described in Figure 3. (A) Effects of HX109 on hPSA protein secretion were analyzed by ELISA after 24 h. #### p < 0.0001 (one-way ANOVA) compared with control, * p < 0.05, *** p < 0.001, **** p < 0.0001 (one-way ANOVA) compared with TP only. (B) Effects of HX109 on hPSA protein expression. After 48 h, protein levels in cell lysate were analyzed by western blot. (C) Effects of HX109 on hPSA mRNA expression. The RNA levels were analyzed by quantitative RT-PCR after 24 h. Values were normalized to GAPDH for both protein and RNA analysis. #### p < 0.0001 compared with control, *** p < 0.001, **** p < 0.0001 (one-way ANOVA) compared with TP only. All data are represented as mean ± S.E.M. of three independent experiments. ‘+’ means ‘treated with TP or HX109’, if it is on the right side of TP, it means ‘treated with TP’; if it is on the right side of HX109, it means ’treated with HX109’. ‘−’ means ‘not treated with TP or HX109’.
Figure 5
Figure 5
HX109 inhibited androgen receptor (AR) transcriptional activity without affecting AR expression and translocation. (A) Effects of HX109 on luciferase activity. LNCaP cells were transfected with control or luciferase reporter plasmid containing androgen receptor response element (ARE) sequence for 24 h. Transfected cells were treated with or without 100 nM TP in the presence of various concentrations of HX109 for 18 h. Luciferase activity was measured as described in the Materials and Methods section. #### p < 0.0001 (one-way ANOVA) compared with control, * p < 0.05, ** p < 0.001, *** p < 0.0001 (one-way ANOVA) compared with TP only. (B) The protein levels of AR were analyzed by western blot after 24 h treatment with HX109. (C) Effects of HX109 on AR translocation. LNCaP cells were treated with 100 nM TP in the presence of various concentrations of HX109 for 3 h. After treatment, nuclear and cytoplasmic extracts were collected and subjected to western blot. For western blot, three independent experiments were performed, and one representative result is presented here. All values are shown as mean ± S.E.M. of three independent experiments. ‘+’ means ‘treated with TP or HX109’, if it is on the right side of TP, it means ‘treated with TP’; if it is on the right side of HX109, it means ’treated with HX109’. ‘−’ means ‘not treated with TP or HX109’.
Figure 6
Figure 6
HX109 regulated AR transcriptional activity by phosphorylation of CAMKKβ and upregulation of ATF3. LNCaP cells were treated as described in Figure 3, and total RNAs and proteins were prepared and analyzed for ATF3 by quantitative RT-PCR and western blot, respectively. Effects of HX109 on ATF3 RNA (A) and protein (B) levels were measured after a 6 h or 8 h treatment with HX109, respectively. ** p < 0.01, *** p < 0.001 (one-way ANOVA) compared with TP only. LNCaP cells were transfected with ATF3 siRNA or control siRNA for 24 h and then treated with 100 nM TP in the presence of HX109 1 mg/mL. (C) The expression of hPSA RNA levels were measured by quantitative RT-PCR after 24 h treatment. *** p < 0.001. (D) The protein levels of ATF3 were determined by western blot after 8 h treatment. (E) Effects of HX109 on the phosphorylation of CAMKKβ were measured by western blot. Total proteins were prepared after 30 min of TP and HX109 treatment. (F) LNCaP cells were incubated with 30 μM STO-609 for 30 min and treated with 100 nM TP in the presence of 1 mg/mL HX109 for 24 h. The RNA levels of hPSA were measured by quantitative RT-PCR. Values of qRT-PCR were normalized to GAPDH. *** p < 0.001 (one-way ANOVA) compared with TP only. n.s, not significant. For western blot, three independent experiments were performed, and one representative result is shown here. All values are shown as mean ± S.E.M. of three independent experiments. ‘+’ means ‘treated with TP or HX109’, if it is on the right side of TP, it means ‘treated with TP’; if it is on the right side of HX109, it means ’treated with HX109’. ‘−’ means ‘not treated with TP or HX109’.
Figure 7
Figure 7
Calcium increase by HX109 plays a crucial role in the regulation of AR transcriptional activity. (A) Effects of HX109 on intracellular calcium levels. LNCaP cells were treated with 100 nM TP in the presence of HX109 1 mg/mL. Calcium levels were measured as described in the Materials and Methods section. ** p < 0.01 (one-way ANOVA) compared with TP only. (B) Effects of HX109 on calcium chelating condition. LNCaP cells were incubated with 20 μM BAPTA-AM for 30 min and treated with 100 nM TP in the presence of 1 mg/mL HX109 for 24 h. The RNA levels of hPSA were measured by quantitative RT-PCR. Values were normalized to GAPDH. *** p < 0.001 (one-way ANOVA) compared with TP only. n.s, not significant. All data are shown as mean ± S.E.M. of three independent experiments. ‘+’ means ‘treated with TP or HX109’, if it is on the right side of TP, it means ‘treated with TP’; if it is on the right side of HX109, it means ’treated with HX109’. ‘−’ means ‘not treated with TP or HX109’.

Similar articles

Cited by

References

    1. McVary K.T. BPH: Epidemiology and comorbidities. Am. J. Manag. Care. 2006;12:S122–S128. - PubMed
    1. Parsons J.K., Bergstrom J., Silberstein J., Barrett-Connor E. Prevalence and characteristics of lower urinary tract symptoms in men aged > or = 80 years. Urology. 2008;72:318–321. doi: 10.1016/j.urology.2008.03.057. - DOI - PMC - PubMed
    1. Sarma A.V., Wei J.T. Clinical practice. Benign prostatic hyperplasia and lower urinary tract symptoms. N. Engl. J. Med. 2012;367:248–257. doi: 10.1056/NEJMcp1106637. - DOI - PubMed
    1. Roehrborn C.G. Pathology of benign prostatic hyperplasia. Int. J. Impot. Res. 2008;20:S11–S18. doi: 10.1038/ijir.2008.55. - DOI - PubMed
    1. Untergasser G., Madersbacher S., Berger P. Benign prostatic hyperplasia: Age-related tissue-remodeling. Exp. Gerontol. 2005;40:121–128. doi: 10.1016/j.exger.2004.12.008. - DOI - PubMed

MeSH terms