. 2018 Dec 7;15(12):2779.
doi: 10.3390/ijerph15122779.

Decomposition Analysis of Factors Affecting Changes in Industrial Wastewater Emission Intensity in China: Based on a SSBM-GMI Approach

Affiliations

Decomposition Analysis of Factors Affecting Changes in Industrial Wastewater Emission Intensity in China: Based on a SSBM-GMI Approach

Yongyi Cheng et al. Int J Environ Res Public Health. .

Abstract

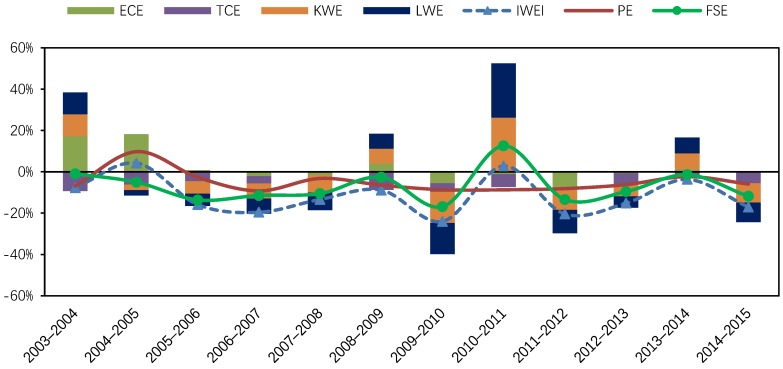
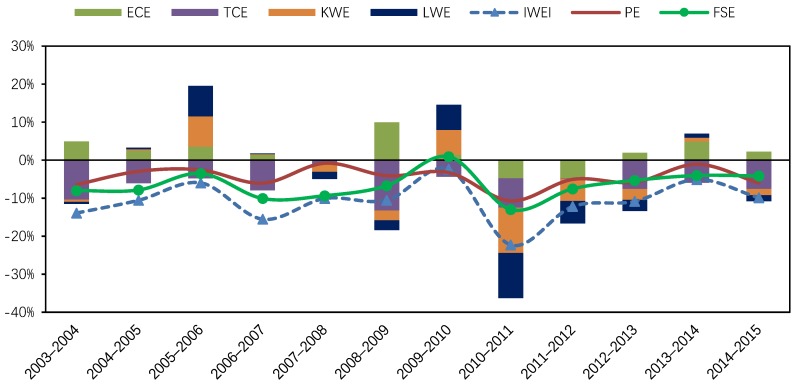
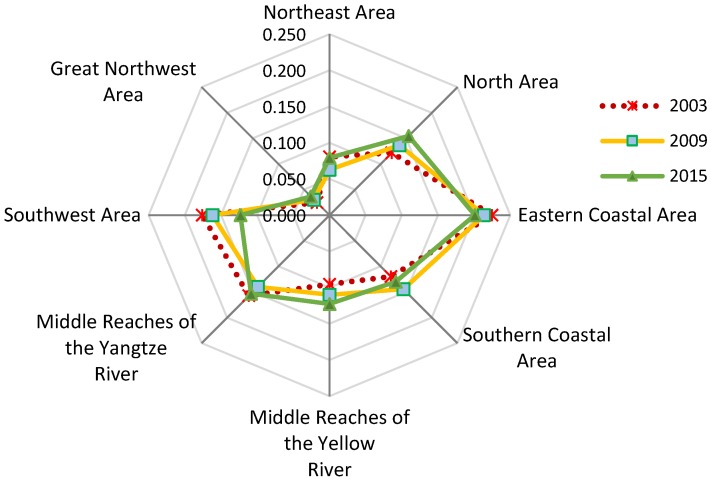
This paper investigated the factors driving the changes in industrial wastewater emission intensity (IWEI) across provinces in China. To do this, we proposed a Super-efficiency Slacks-based Measure-Global Malmquist Index (SSBM-GMI) to decompose the change in IWEI into the effects from efficiency change (ECE), technological change (TCE), capital⁻wastewater substitution (KWE) and labor⁻wastewater substitution (LWE). The method was applied to conduct an empirical study using Chinese provincial data from 2003⁻2015. The main findings include the following: firstly, TCE was the dominant driving force behind the reduction in IWEI with an average annual contribution of -6.4% at the national level, followed by KWE (-5.3%), LWE (-1.8%) and ECE (1.2%). Secondly, significant differences exist in the driving factors behind the reduction in IWEI across regions. The reduction in IWEIs in the Northeast area and the Great Northwest area was mainly driven by productivity growth, while the reduction in IWEIs in the other areas was mainly driven by factor substitution. Thirdly, the shortage of KWE and LWE has impeded IWEI reduction in the Great Northwest area, the Middle Reaches of the Yellow River, the Northeast area and the North area. Finally, some particular policy implications were also recommended for reducing industrial wastewater emission in China.

Keywords: driving factor; green total factor productivity; industrial economic growth; industrial wastewater emission intensity; production-theoretical decomposition analysis (PDA); slack-based measure (SBM); sustainable development.


Conflict of interest statement

The authors declare no conflict of interest. The funders had no role in the design of the study; in the collection, analyses, or interpretation of data; in the writing of the manuscript, and in the decision to publish the results.

Figures

Figure B1
Figure B1
Driving factors of industrial wastewater emission intensity change in the Northeast Area, 2003–2015. ECE: the effect of technical efficiency change; TCE: the effect of technological change; KWE: the effect of capital–wastewater substitution; LWE: the effect of labor–wastewater substitution; IWEI: industrial wastewater emission intensity; PE: productivity effect; FSE: factor substitution effect.
Figure B2
Figure B2
Driving factors of industrial wastewater emission intensity change in the North Area, 2003–2015. ECE: the effect of technical efficiency change; TCE: the effect of technological change; KWE: the effect of capital–wastewater substitution; LWE: the effect from labor–wastewater substitution; IWEI: industrial wastewater emission intensity; PE: productivity effect; FSE: factor substitution effect.
Figure B3
Figure B3
Driving factors of industrial wastewater emission intensity change in the Eastern Coastal Area, 2003–2015. ECE: the effect of technical efficiency change; TCE: the effect of technological change; KWE: the effect of capital–wastewater substitution; LWE: the effect of labor–wastewater substitution; IWEI: industrial wastewater emission intensity; PE: productivity effect; FSE: factor substitution effect.
Figure B4
Figure B4
Driving factors of industrial wastewater emission intensity change in the Southern Coastal Area, 2003–2015. ECE: the effect of technical efficiency change; TCE: the effect of technological change; KWE: the effect of capital–wastewater substitution; LWE: the effect of labor–wastewater substitution; IWEI: industrial wastewater emission intensity; PE: productivity effect; FSE: factor substitution effect.
Figure B5
Figure B5
Driving factors of industrial wastewater emission intensity change in the Middle Reaches of the Yellow River, 2003–2015. ECE: the effect of technical efficiency change; TCE: the effect of technological change; KWE: the effect of capital–wastewater substitution; LWE: the effect of labor–wastewater substitution; IWEI: industrial wastewater emission intensity; PE: productivity effect; FSE: factor substitution effect.
Figure B6
Figure B6
Driving factors of industrial wastewater emission intensity change in the Middle Reaches of the Yangtze River, 2003–2015. ECE: the effect of technical efficiency change; TCE: the effect of technological change; KWE: the effect of capital–wastewater substitution; LWE: the effect of labor–wastewater substitution; IWEI: industrial wastewater emission intensity; PE: productivity effect; FSE: factor substitution effect.
Figure B7
Figure B7
Driving factors of industrial wastewater emission intensity change in the Southwest Area, 2003–2015. ECE: the effect of technical efficiency change; TCE: the effect of technological change; KWE: the effect of capital–wastewater substitution; LWE: the effect of labor–wastewater substitution; IWEI: industrial wastewater emission intensity; PE: productivity effect; FSE: factor substitution effect.
Figure B8
Figure B8
Driving factors of industrial wastewater emission intensity change in the Great Northwest Area, 2003–2015. ECE: the effect from technical efficiency change; TCE: the effect of technological change; KWE: the effect of capital–wastewater substitution; LWE: the effect of labor–wastewater substitution; IWEI: industrial wastewater emission intensity; PE: productivity effect; FSE: factor substitution effect.
Figure 1
Figure 1
China’s regional industrial wastewater emission intensity, 2003–2015. Data resources: Annual Statistic Report on Environment in China [16]. IWEI: Industrial wastewater emission intensity.
Figure 2
Figure 2
The eight study areas in China.
Figure 3
Figure 3
Regional contrast of the change in industrial wastewater emission intensity, 2003–2015. Data resources: Annual Statistic Report on Environment in China [16].
Figure 4
Figure 4
Driving factors of IWEI change at the national level, 2003–2015. ECE: the effect of technical efficiency change; TCE: the effect of technological change; KWE: the effect of capital–wastewater substitution; LWE: the effect of labor–wastewater substitution; IWEI: industrial wastewater emission intensity; PE: productivity effect; FSE: factor substitution effect.
Figure 5
Figure 5
Regional differences in the driving factors of changes in industrial wastewater emission intensity, 2003–2015. PE: productivity effect; FSE: factor substitution effect; IWEI: industrial wastewater emission intensity.
Figure 6
Figure 6
Differences in the driving factors of IWEI change in the eight areas, 2003–2015. ECE: the effect of technical efficiency change; TCE: the effect of technological change; KWE: the effect of capital–wastewater substitution; LWE: the effect of labor–wastewater substitution; IWEI: industrial wastewater emission intensity.
Figure 7
Figure 7
Changes in industrial capital and industrial wastewater emission in the eight areas, 2003–2015. IWE: industrial wastewater emission. Data resources: Annual Statistic Report on Environment in China [16] and China Statistical Yearbook [55].
Figure 8
Figure 8
National shares of industrial wastewater emission in the eight areas, 2003–2015. Data resources: Annual Statistic Report on Environment in China [16].

Similar articles

Cited by

References

    1. Yale Center for Environmental Law & Policy, Yale University. Center for International Earth Science Information Network, Columbia University 2018 Environmental Performance Index. [(accessed on 7 May 2018)]; Available online: https://epi.envirocenter.yale.edu/downloads/epi2018policymakerssummaryv0....
    1. Ebenstein A. The consequences of industrialization: Evidence from water pollution and digestive cancers in china. Rev. Econ. Stat. 2012;94:186–201. doi: 10.1162/REST_a_00150. - DOI
    1. Zhang J. The impact of water quality on health: Evidence from the drinking water infrastructure program in rural china. J. Health Econ. 2012;31:122–134. doi: 10.1016/j.jhealeco.2011.08.008. - DOI - PubMed
    1. The Ministry of Water Resources of the People’s Republic of China China Water Resources Bulletin 2016. [(accessed on 2 May 2018)]; Available online: http://www.mwr.gov.cn/sj/tjgb/szygb/201707/t20170711_955305.html.
    1. Zhang L., Adom P.K., An Y. Regulation-induced structural break and the long-run drivers of industrial pollution intensity in china. J. Clean. Prod. 2018;198:121–132. doi: 10.1016/j.jclepro.2018.07.008. - DOI

Publication types

LinkOut - more resources