. 2018 Dec 9;18(12):4347.
doi: 10.3390/s18124347.

Data Analytics of a Wearable Device for Heat Stroke Detection

Affiliations

Data Analytics of a Wearable Device for Heat Stroke Detection

Shih-Sung Lin et al. Sensors (Basel). .

Abstract

When exercising in a high-temperature environment, heat stroke can cause great harm to the human body. However, runners may ignore important physiological warnings and are not usually aware that a heat stroke is occurring. To solve this problem, this study evaluates a runner's risk of heat stroke injury by using a wearable heat stroke detection device (WHDD), which we developed previously. Furthermore, some filtering algorithms are designed to correct the physiological parameters acquired by the WHDD. To verify the effectiveness of the WHDD and investigate the features of these physiological parameters, several people were chosen to wear the WHDD while conducting the exercise experiment. The experimental results show that the WHDD can identify high-risk trends for heat stroke successfully from runner feedback of the uncomfortable statute and can effectively predict the occurrence of a heat stroke, thus ensuring safety.

Keywords: exercise experiment; filtering algorithm; heat stroke; physiological parameters.


Conflict of interest statement

The authors declare no conflict of interest.

Figures

Figure 1
Figure 1
Architecture of the system.
Figure 2
Figure 2
Photograph of the wearable heat stroke detection device (WHDD) on a human body.
Figure 3
Figure 3
Workflow of the WHDD.
Figure 4
Figure 4
Workflow for collecting physiological information before running.
Figure 5
Figure 5
Workflow for extracting information on the surrounding environment and the user’s physiological condition (main program).
Figure 6
Figure 6
Heart rate data measured with the commercial heart rate belt.
Figure 7
Figure 7
Thermal camera and measured dynamic body temperature map.
Figure 8
Figure 8
Comparison between original and filtered heart rate when the user was at rest.
Figure 9
Figure 9
Comparison between the original and filtered body temperature when the user was at rest.
Figure 10
Figure 10
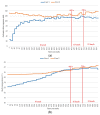
Comparison between the physiological data and the feedback signals of the four users during running. (a) Galvanic skin response (GSR); (b) body temperature; (c) heartbeat; and (d) heatstroke risk level.
Figure 10
Figure 10
Comparison between the physiological data and the feedback signals of the four users during running. (a) Galvanic skin response (GSR); (b) body temperature; (c) heartbeat; and (d) heatstroke risk level.
Figure 11
Figure 11
Comparison of skin inductance values in the testing group that did not report uncomfortable conditions (user 1 and 2). (a) Galvanic skin response (GSR); (b) body temperature; (c) heartbeat; and (d) heatstroke risk level.
Figure 11
Figure 11
Comparison of skin inductance values in the testing group that did not report uncomfortable conditions (user 1 and 2). (a) Galvanic skin response (GSR); (b) body temperature; (c) heartbeat; and (d) heatstroke risk level.
Figure 12
Figure 12
Comparison of skin inductance values in the testing group that reported uncomfortable conditions (user 3 and 4). (a) Galvanic skin response (GSR); (b) body temperature; (c) heartbeat; and (d) heatstroke risk level.
Figure 12
Figure 12
Comparison of skin inductance values in the testing group that reported uncomfortable conditions (user 3 and 4). (a) Galvanic skin response (GSR); (b) body temperature; (c) heartbeat; and (d) heatstroke risk level.
Figure 13
Figure 13
Comparison between the physiological data and the feedback signals of the five users during running outdoors. (a) Galvanic skin response (GSR); (b) body temperature; (c) heartbeat; and (d) heatstroke risk level.
Figure 13
Figure 13
Comparison between the physiological data and the feedback signals of the five users during running outdoors. (a) Galvanic skin response (GSR); (b) body temperature; (c) heartbeat; and (d) heatstroke risk level.
Figure 14
Figure 14
Three-dimensional relationship map between heart rate, temperature, and heat stroke risk level.
Figure 15
Figure 15
Comparison of heat stroke risk indicators for users feeling uncomfortable during the experimental tests (users 3 and 4).

References

    1. Global Climate Report—Annual 2017. [(accessed on 14 October 2018)]; Available online: https://www.ncdc.noaa.gov/sotc/global/201713.
    1. Guidelines for the Identification of Professional Diseases Caused by Heat Hazards. [(accessed on 30 October 2018)]; Available online: https://www.osha.gov.tw/1106/1176/1185/1190/1194/
    1. Gerrett N., Redortier B., Voelcker T., Havenith G. A comparison of galvanic skin conductance and skin wettedness as indicators of thermal discomfort during moderate and high metabolic rates. J. Therm. Boil. 2013;38:530–538. doi: 10.1016/j.jtherbio.2013.09.003. - DOI
    1. Mizota N., Lu H., Nakashima S., Zhang L., Serikawa S., Kitazono Y. Proposal of alert system for prevention of heat stroke; Proceedings of the 2012 IEEE/SICE International Symposium on System Integration (SII); Fukuoka, Japan. 16–18 December 2012; pp. 111–116. - DOI
    1. Casper R., Schlosser K., Pascucci R., Feldman J. Is it exertional heatstroke or something more? A case report. J. Emerg. Med. 2016;51:e1–e5. - PubMed

MeSH terms

LinkOut - more resources