UPLC-Q/TOF-MS-Based Serum Metabolomics Reveals Hypoglycemic Effects of Rehmannia glutinosa, Coptis chinensis and Their Combination on High-Fat-Diet-Induced Diabetes in KK-Ay Mice
- PMID: 30544908
- PMCID: PMC6320869
- DOI: 10.3390/ijms19123984
UPLC-Q/TOF-MS-Based Serum Metabolomics Reveals Hypoglycemic Effects of Rehmannia glutinosa, Coptis chinensis and Their Combination on High-Fat-Diet-Induced Diabetes in KK-Ay Mice
Abstract
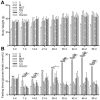
Diabetes is a worldwide severe health issue which causes various complications. This study aimed to evaluate the hypoglycemic effects of Rehmannia glutinosa (RG), Coptis chinensis (CC) alone and their combination on high-fat-diet-induced diabetes in mice via biochemical assays and UPLC-Q/TOF-MS-based serum metabolomic analysis. Diabetic KK-Ay mice were induced by high-fat diet and treated for eight weeks, separately with RG, CC and their combination and the positive control drug metformin. Administration of RG and CC alone, and their combination could decrease the fasting blood glucose level, ameliorate the tolerance of glucose, and recover the levels of total cholesterol (TC), triglycerides (TG), high-density lipoprotein cholesterol (HDL-C), and low-density lipoprotein cholesterol (LDL-C) in sera of diabetic mice. Orthogonal partial least squares discriminant analysis (OPLS-DA) on serum metabolomes revealed that 79 ESI⁺ and 76 ESI- metabolites were changed by diabetes mellitus (DM) compared to the normal control. Heatmaps on these diabetes-related metabolites showed that CC and RG/CC were clustered closer with the normal control, indicating that they had the better antidiabetic effects at the metabolite level. Fifteen of the differential metabolites in DM serum were annotated and their related metabolic pathways were lipid metabolism. These data suggested that RG and CC alone and in combination treatment had the antidiabetic activity in lowering glycemia and improving lipid metabolism. UPLC-Q/TOF-MS-based metabolomics shed light on the differential metabolite effects of RG and CC in DM treatment. However, it should be noted that some differential metabolites were possibly generated or not detected due to our groupwise run order, which possibly contributed to or covered the group difference in our experiment. They need to be further discriminated in the future work.
Keywords: Coptis chinensis; Rehmannia glutinosa; UPLC-Q/TOF-MS; diabetes; high-fat diet; hypoglycemic effect; metabolomics.
Conflict of interest statement
The authors declared no conflict of interest. The funders had no role in the design of the study; in the collection, analyses, or interpretation of data; in the writing of the manuscript, or in the decision to publish the results.
Figures


Similar articles
-
The anti-diabetic activities, gut microbiota composition, the anti-inflammatory effects of Scutellaria-coptis herb couple against insulin resistance-model of diabetes involving the toll-like receptor 4 signaling pathway.J Ethnopharmacol. 2019 Jun 12;237:202-214. doi: 10.1016/j.jep.2019.02.040. Epub 2019 Feb 23. J Ethnopharmacol. 2019. PMID: 30807814
-
Rehmannia glutinosa (Gaertn.) DC. polysaccharide ameliorates hyperglycemia, hyperlipemia and vascular inflammation in streptozotocin-induced diabetic mice.J Ethnopharmacol. 2015 Apr 22;164:229-38. doi: 10.1016/j.jep.2015.02.026. Epub 2015 Feb 17. J Ethnopharmacol. 2015. PMID: 25698243
-
Metabolomics study of the therapeutic mechanism of Schisandra Chinensis lignans in diet-induced hyperlipidemia mice.Lipids Health Dis. 2017 Aug 1;16(1):145. doi: 10.1186/s12944-017-0533-3. Lipids Health Dis. 2017. PMID: 28764799 Free PMC article.
-
Metabolomics-based evidence of the hypoglycemic effect of Ge-Gen-Jiao-Tai-Wan in type 2 diabetic rats via UHPLC-QTOF/MS analysis.J Ethnopharmacol. 2018 Jun 12;219:299-318. doi: 10.1016/j.jep.2018.03.026. Epub 2018 Mar 23. J Ethnopharmacol. 2018. PMID: 29580854
-
Extraction, structure and bioactivities of polysaccharides from Rehmannia glutinosa: A review.J Ethnopharmacol. 2023 Apr 6;305:116132. doi: 10.1016/j.jep.2022.116132. Epub 2023 Jan 10. J Ethnopharmacol. 2023. PMID: 36634722 Review.
Cited by
-
An novel effective and safe model for the diagnosis of nonalcoholic fatty liver disease in China: gene excavations, clinical validations, and mechanism elucidation.J Transl Med. 2024 Jul 4;22(1):624. doi: 10.1186/s12967-024-05315-3. J Transl Med. 2024. PMID: 38965537 Free PMC article.
-
Jianpi Gushen Huayu decoction ameliorated diabetic nephropathy through modulating metabolites in kidney, and inhibiting TLR4/NF-κB/NLRP3 and JNK/P38 pathways.World J Diabetes. 2024 Mar 15;15(3):502-518. doi: 10.4239/wjd.v15.i3.502. World J Diabetes. 2024. PMID: 38591083 Free PMC article.
-
Profile of the bile acid FXR-FGF15 pathway in the glucolipid metabolism disorder of diabetic mice suffering from chronic stress.PeerJ. 2023 Nov 15;11:e16407. doi: 10.7717/peerj.16407. eCollection 2023. PeerJ. 2023. PMID: 38025699 Free PMC article.
-
Erxian herbal pair enhances bone formation in infected bone nonunion models and attenuates lipopolysaccharide-induced osteoblastinhibition by regulating miRNA-34a-5p.Bioengineered. 2022 Jun;13(6):14339-14356. doi: 10.1080/21655979.2022.2085388. Bioengineered. 2022. PMID: 36694425 Free PMC article.
-
Genomic profiling of WRKY transcription factors and functional analysis of CcWRKY7, CcWRKY29, and CcWRKY32 related to protoberberine alkaloids biosynthesis in Coptis chinensis Franch.Front Genet. 2023 Mar 23;14:1151645. doi: 10.3389/fgene.2023.1151645. eCollection 2023. Front Genet. 2023. PMID: 37035743 Free PMC article.
References
-
- Alam U., Asghar O., Azmi S., Malik R.A. General aspects of diabetes mellitus. Handb. Clin. Neurol. 2014;126:211–222. - PubMed
-
- Dong Y.H., Gao W.G., Zhang L., Wei J., Hammar N., Cabrera C.S., Wu X.L., Qiao Q. Patient characteristics related to metabolic disorders and chronic complications in type 2 diabetes mellitus patients hospitalized at the Qingdao Endocrine and Diabetes Hospital from 2006 to 2012 in China. Diab. Vasc. Dis. Res. 2017;14:24–32. doi: 10.1177/1479164116675489. - DOI - PubMed
MeSH terms
Substances
Grants and funding
LinkOut - more resources
Full Text Sources
Medical
Molecular Biology Databases
Miscellaneous

