Review
. 2018 Dec 11;9(12):621.
doi: 10.3390/genes9120621.

DNA-Based Super-Resolution Microscopy: DNA-PAINT

Affiliations
Review

DNA-Based Super-Resolution Microscopy: DNA-PAINT

Daniel J Nieves et al. Genes (Basel). .

Abstract

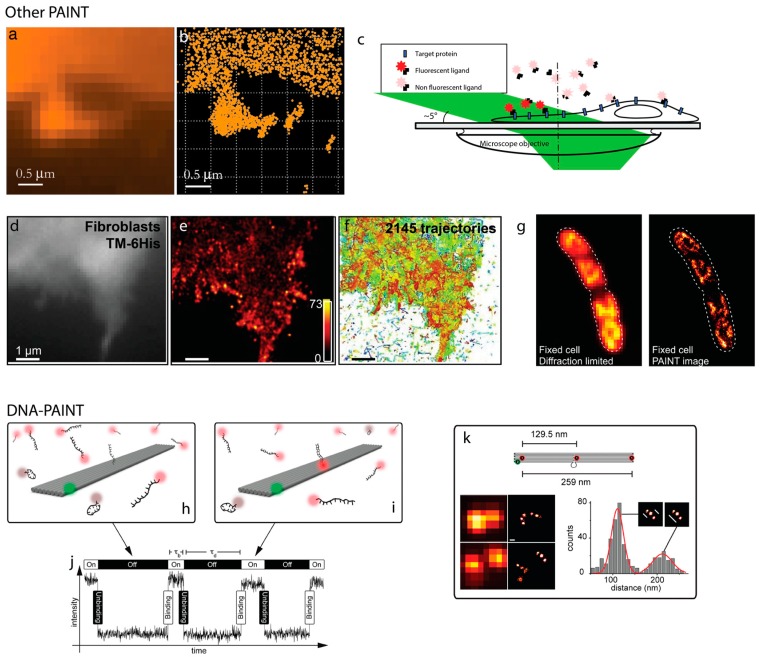
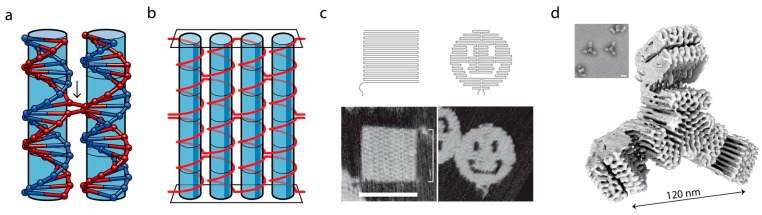
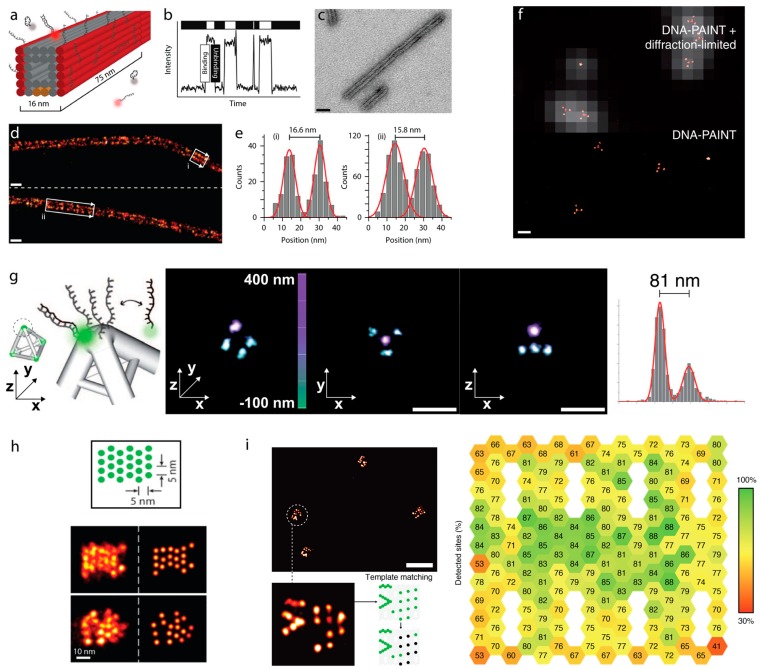
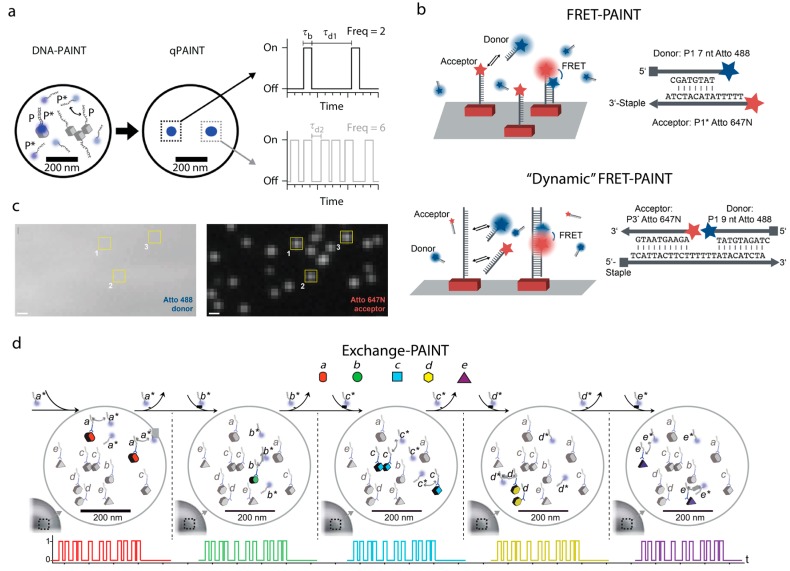
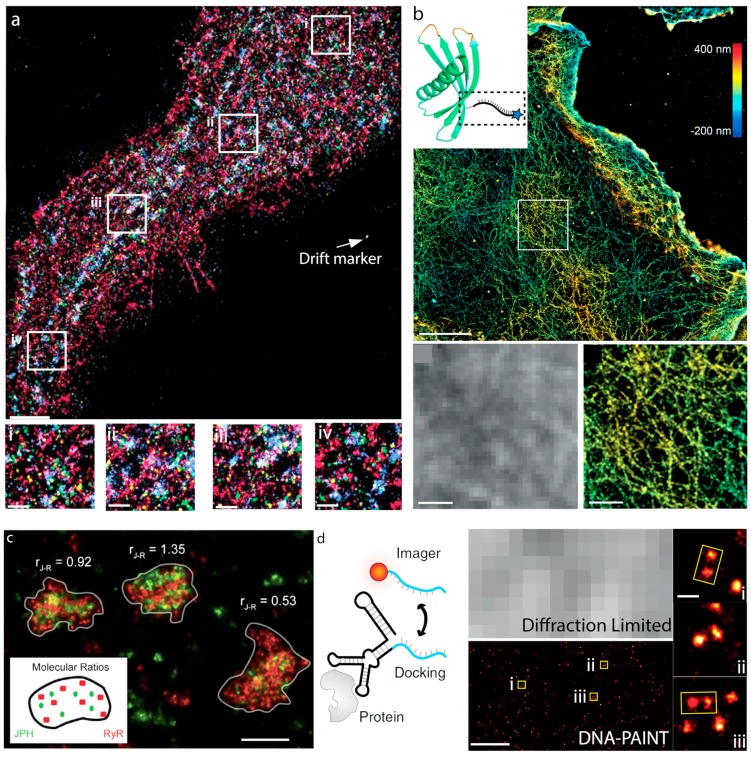
Super-resolution microscopies, such as single molecule localization microscopy (SMLM), allow the visualization of biomolecules at the nanoscale. The requirement to observe molecules multiple times during an acquisition has pushed the field to explore methods that allow the binding of a fluorophore to a target. This binding is then used to build an image via points accumulation for imaging nanoscale topography (PAINT), which relies on the stochastic binding of a fluorescent ligand instead of the stochastic photo-activation of a permanently bound fluorophore. Recently, systems that use DNA to achieve repeated, transient binding for PAINT imaging have become the cutting edge in SMLM. Here, we review the history of PAINT imaging, with a particular focus on the development of DNA-PAINT. We outline the different variations of DNA-PAINT and their applications for imaging of both DNA origamis and cellular proteins via SMLM. Finally, we reflect on the current challenges for DNA-PAINT imaging going forward.

Keywords: DNA; DNA PAINT; DNA origami; SMLM; fluorescence microscopy; super-resolution microscopy.


Conflict of interest statement

The authors declare no conflict of interest.

Figures

Figure 1
Figure 1
Examples of point-accumulated imaging for nanoscale topography (PAINT). (a) Initial implementation of PAINT from [10] showing raw fluorescence image from Nile Red imaging of a supported bilayer and (b) high-resolution image by the localization of 2778 single Nile Red probes collected in 4095 frames. (c) Schematic of universal PAINT (uPAINT) imaging showing exchange of sub-populations of fluorescent ligands, and super-resolution imaging (d) of TM-6His, transmembrane domain of the PDGF receptor fused to a six-histidine (6His) tag on its extracellular side, using 2045 trajectories (e). (f) Super-resolution PAINT imaging of green fluorescent protein (GFP)-Fis using JF646-Hoechst after 30 min FA fixation, adapted from [15]. (g) Schematic of DNA-PAINT. A DNA origami tile is marked with a green fluorophore and the docking strand (center of tile) is imaged when the imager-strand (red fluorophore) is transiently bound to the docking strand and, thus, the tile (h). Intensity versus time plots the time between binding events can be resolved (i). DNA-PAINT used to resolve the spatial separation of multiple docking sites (j). Images in (be) adapted from [11]; in (gj) adapted from [17].
Figure 2
Figure 2
DNA Origami: (a) Basis of DNA origami is the Holliday junction, where a single strand of DNA crosses over to form a ‘crossover’ between adjacent helices. When two Holliday junctions sit along the same pair of helices this forms a double crossover. (b) If multiple Holliday junctions are arranged along multiple parallel helices this stitches the helices together to form a tile (adapted from [22]). (c) Original DNA origami tile designs and AFM from [23], showing tile and ‘three holed disc’. Scale bar = 100 nm. (d) CryoEM single particle reconstruction to 2.5 Å showing state of the art subunits for gigadalton assembly from [24]. Inset: representative field of view TEM micrograph, scale bar = 50 nm.
Figure 3
Figure 3
DNA-PAINT on DNA origamis. (a) A hollow interior 3D DNA origami polymer is decorated with single stranded docker strands on opposite faces. (b) Transient binding between imager and docker produces blinking that can be used for localization or kinetic quantification. (c) Transmission electron microscopy of the origami polymers (scale bar = 20 nm). (d) DNA-PAINT super-resolution image of the DNA origami polymer. (e) Histograms of cross-sections in boxed areas from (d). Images in (ae) from [39]. (f) Overlay of diffraction limited and DNA-PAINT image of tetrahedron DNA-origamis (top), with the DNA-PAINT image alone showing spots corresponding to the vertices of the origami (scale bar = 200 nm). (g) 3D DNA-PAINT, achieved by SMLM imaging of PSF modified by a cylindrical lens of the same origamis in f) revealing that the length of each side of the tetrahedron could be accurately determined (scale bars = 200 nm). Images in (f,g) from [41]. (h) DNA-PAINT imaging to resolve sites spaced 5 nm apart on origami tile. Image from [44]. (i) DNA-PAINT imaging used to determine the incorporation efficiency of staples on an origami tile, with the percentage of staples detected in each position represented in the pictogram (left). Image from [45].
Figure 4
Figure 4
Extended applications of DNA-PAINT. (a) qPAINT. Two different complexes unresolvable by DNA-PAINT imaging with one or three docking strands. The two complexes, owing to the predictable binding of the imager strand to the docking strand, have characteristic blinking traces, with the complex possessing 3 docking strands having an increased frequency of binding events. By observing the time between events the number of docking strands can be determined from such traces given a single docking site calibration. Image adapted from [37]. (b) Fluorescence resonance energy transfer (FRET)-PAINT relies on bringing imager DNA with a donor fluorophore into proximity with DNA possessing an acceptor fluorophore. There are two routes for such imaging, one where the acceptor is fixed to the docking strand (top) and another where both the acceptor and donor are free in solution and require hybridization to a longer docking strand, termed ‘dynamic’ FRET-PAINT. (c) The FRET-PAINT approach allows very specific emission only when there is an acceptor present and in proximity short enough for FRET to be observed, which reduces the background from high imager concentration. As an example, the constant signal in the donor channel (left) can be compared with punctate signals in the acceptor channel when the donor is bound (right, boxes 1–3). Scale bars = 500 nm. Images adapted from [38]. (d) Exchange-PAINT relies on the ability to generate docking strand with mutually exclusive docking sequences (ae). This means that each docking strand can only be sampled by its complementary imaging strand (a*e*). Thus, repeated cycles of imaging, washing, and then imaging with a different complementary imager can be exploited to observe multiple species within a sample, and gives great scope for multiplexed imaging. Images adapted from [48].
Figure 5
Figure 5
Cellular Imaging using DNA-PAINT. (a) Multiplexed Exchange-PAINT of EGFR (red), ErbB2 (green), ErbB3 (blue), IGF-1R (yellow) and Met (purple) in fixed BT-20 cells (top, scale bar-5 µm). Zoomed regions (iiv) for different areas of the plasma membrane with the different protein imaged merged (scale bar = 1 µm). Images are from [48]. (b) 3D DNA-PAINT of the actin cytoskeleton using labeling with affimer probes (top; scale bar = 5 µm), inset—schematic of ribbon-structure of affimer probe with DNA docking strand attached. Comparison of diffraction limited image (left) from boxed region to 3D DNA-PAINT image (right). Scale bar = 1 µm. Images are from [60]. (c) qPAINT imaging of RyR (red) and junctophilin-1 (green) clusters. Numbers indicate ratios of junctophilin-1 to RyR (scale bar—250 nm). Images are from [47]. (d) SOMAmers for DNA-PAINT imaging of single proteins on fixed and live cells. Schematic of SOMAmers labeling and application to EGFRs in the plasma membrane (left). Comparison of diffraction limited image (top, middle) to the DNA-PAINT final convolved image (bottom, middle). Scale bar = 200 nm. EGFR dimers observed in the DNA-PAINT image, regions (iiii) corresponding to identified dimers (scale bar = 20 nm). Images are from [61].

References

    1. Chalfie M., Tu Y., Euskirchen G., Ward W.W., Prasher D.C. Green fluorescent protein as a marker for gene expression. Science. 1994;263:802–805. doi: 10.1126/science.8303295. - DOI - PubMed
    1. Betzig E. Single Molecules, cells, and super-resolution optics (Nobel Lecture) Angew. Chem. Int. Ed. Engl. 2015;54:8034–8053. doi: 10.1002/anie.201501003. - DOI - PubMed
    1. Hell S.W. Nanoscopy with focused light (Nobel Lecture) Angew. Chem. Int. Ed. Engl. 2015;54:8054–8066. doi: 10.1002/anie.201504181. - DOI - PubMed
    1. Moerner W.E. Single-molecule spectroscopy, imaging, and photocontrol: Foundations for super-resolution microscopy (Nobel Lecture) Angew. Chem. Int. Ed. Engl. 2015;54:8067–8093. doi: 10.1002/anie.201501949. - DOI - PubMed
    1. Betzig E., Patterson G.H., Sougrat R., Lindwasser O.W., Olenych S., Bonifacino J.S., Davidson M.W., Lippincott-Schwartz J., Hess H.F. Imaging intracellular fluorescent proteins at nanometer resolution. Science. 2006;313:1642–1645. doi: 10.1126/science.1127344. - DOI - PubMed

LinkOut - more resources