Comparative Study
. 2018 Dec 12;19(12):4020.
doi: 10.3390/ijms19124020.

Identification of Two Novel Wheat Drought Tolerance-Related Proteins by Comparative Proteomic Analysis Combined with Virus-Induced Gene Silencing

Affiliations
Comparative Study

Identification of Two Novel Wheat Drought Tolerance-Related Proteins by Comparative Proteomic Analysis Combined with Virus-Induced Gene Silencing

Xinbo Wang et al. Int J Mol Sci. .

Abstract

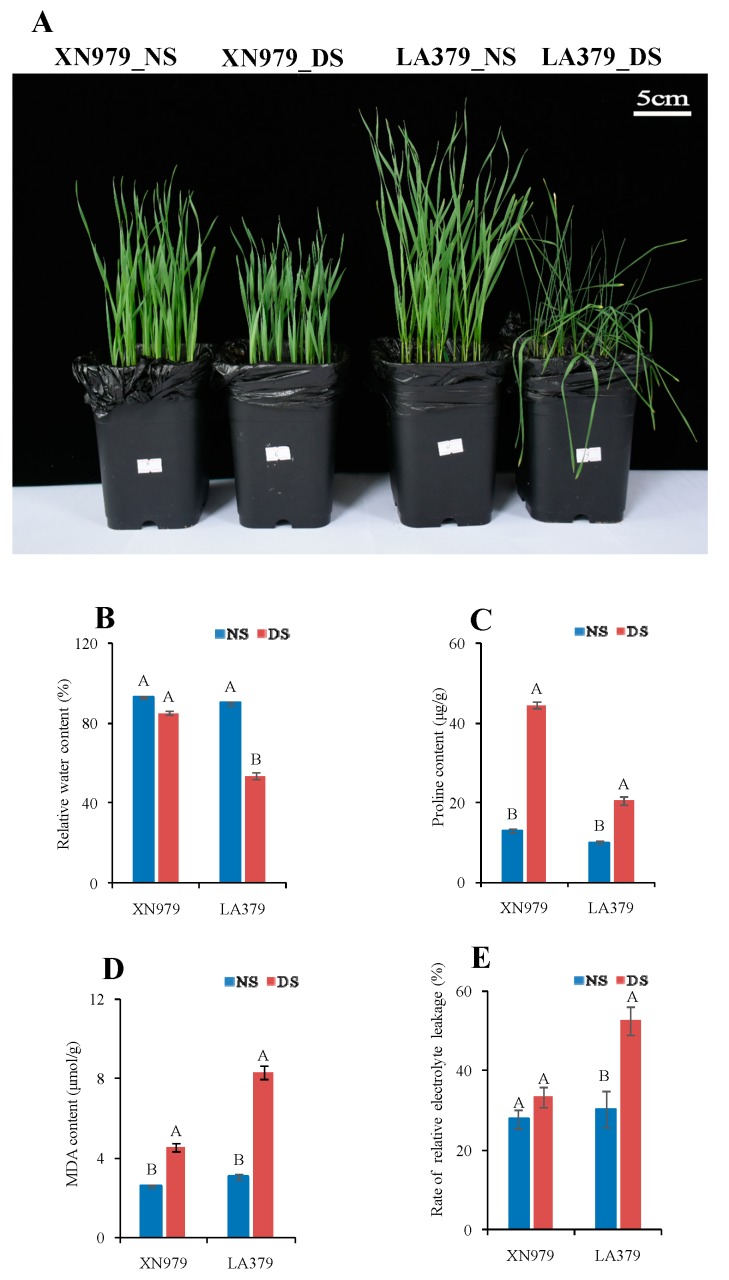
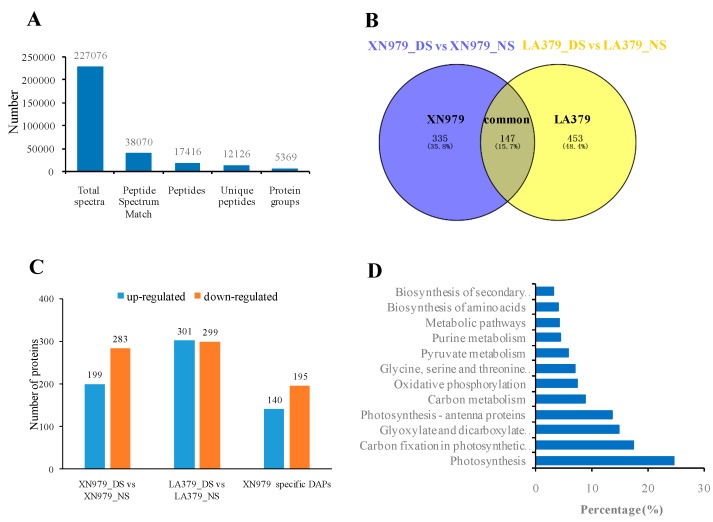
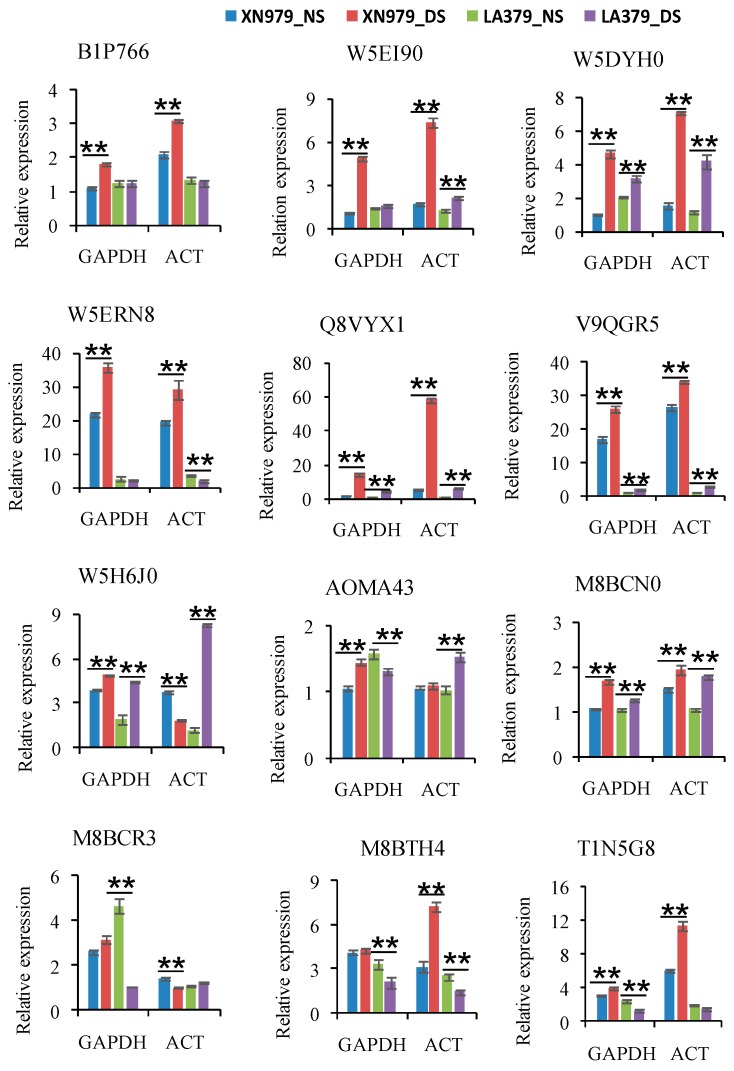
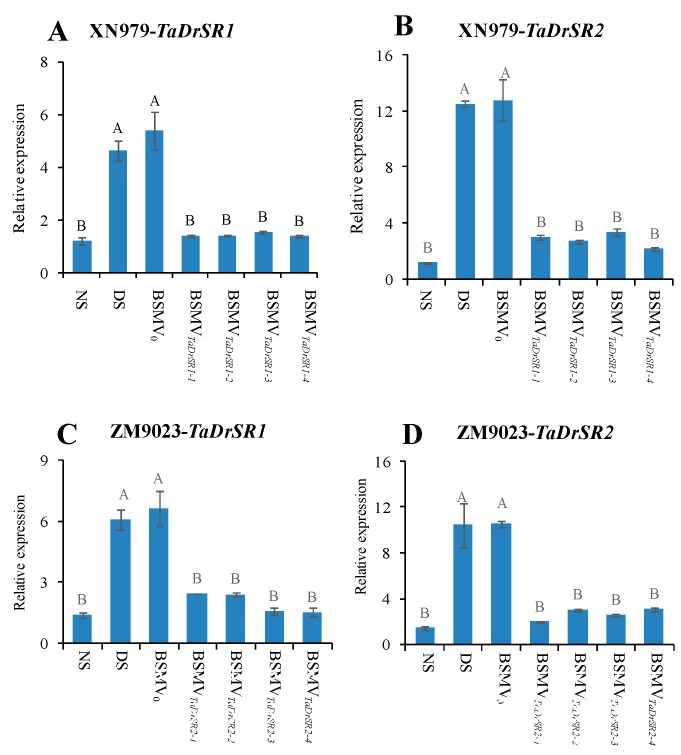
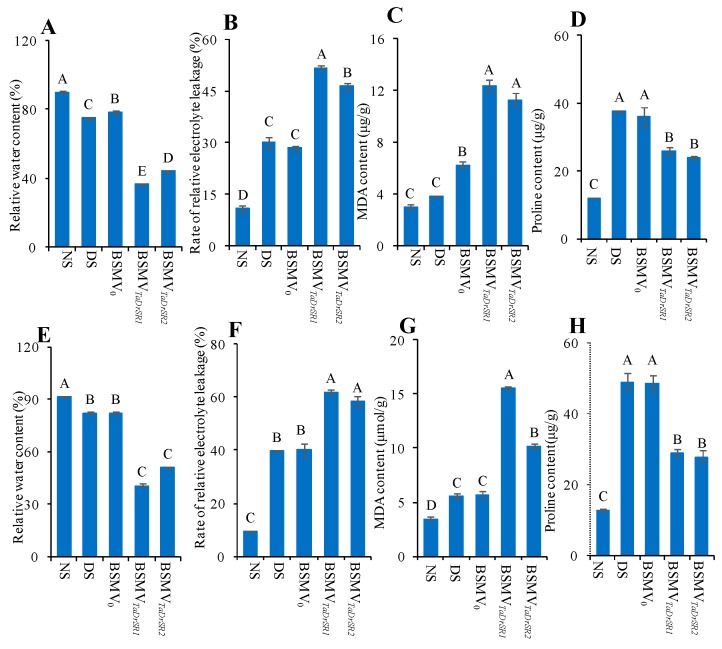
Drought is a major adversity that limits crop yields. Further exploration of wheat drought tolerance-related genes is critical for the genetic improvement of drought tolerance in this crop. Here, comparative proteomic analysis of two wheat varieties, XN979 and LA379, with contrasting drought tolerance was conducted to screen for drought tolerance-related proteins/genes. Virus-induced gene silencing (VIGS) technology was used to verify the functions of candidate proteins. A total of 335 differentially abundant proteins (DAPs) were exclusively identified in the drought-tolerant variety XN979. Most DAPs were mainly involved in photosynthesis, carbon fixation, glyoxylate and dicarboxylate metabolism, and several other pathways. Two DAPs (W5DYH0 and W5ERN8), dubbed TaDrSR1 and TaDrSR2, respectively, were selected for further functional analysis using VIGS. The relative electrolyte leakage rate and malonaldehyde content increased significantly, while the relative water content and proline content significantly decreased in the TaDrSR1- and TaDrSR2-knock-down plants compared to that in non-knocked-down plants under drought stress conditions. TaDrSR1- and TaDrSR2-knock-down plants exhibited more severe drooping and wilting phenotypes than non-knocked-down plants under drought stress conditions, suggesting that the former were more sensitive to drought stress. These results indicate that TaDrSR1 and TaDrSR2 potentially play vital roles in conferring drought tolerance in common wheat.

Keywords: Triticum aestivum L.; VIGS; comparative proteomic analysis; drought stress; iTRAQ.


Conflict of interest statement

The authors declare no conflict of interest.

Figures

Figure 1
Figure 1
Phenotypic changes (A) and physiological responses (BE) of XN979 and LA379 under drought stress (DS) and control (NS) conditions. (A) Phenotypic changes of XN979 and LA379 under drought stress (DS) and control (NS) conditions. (B) Relative water content (RWC); (C) Proline content; (D) malonaldehyde (MDA) content; (E) Rate of relative electrolyte leakage; NS, no stress; DS, drought stress. Three biological replicates were analyzed. Different letters indicate significant differences at P ≤ 0.01 levels.
Figure 2
Figure 2
Statistical analysis of the proteome results and differentially abundant proteins (DAPs) under drought stress (DS) and control (NS) conditions. (A) Statistics for total spectra, matched spectra, matched peptides, unique peptides, and identified proteins. (B) Venn diagram analysis of DAPs in the one-to-one comparisons between NS and DS. (C) Number of up- and down-regulated DAPs in the XN979_DS-XN979_NS comparison, LA379_DS-LA379_NS, and drought-tolerant variety XN979 specific DAPs. (D) Enriched pathways of the DAPs specifically identified in XN979. The values on the abscissa indicate the percentage of the input number of DAPs among the number of the background proteins in the pathway; NS, no stress; DS, drought stress.
Figure 3
Figure 3
Relative mRNA expression analysis of twelve differentially abundant proteins (DAPs) using real-time PCR under drought stress (DS) and no stress (NS) conditions. Each bar shows the mean ± standard errors (SE) of three biological replicates. Two independent trials were conducted using TaGAPDH (GAPDH) and TaActin (ACT) as reference genes, respectively. The relative expression levels of each gene were calculated using the formula 2−∆∆Ct (* P ≤ 0.05; ** P ≤ 0.01, Duncan’s multiple range test).
Figure 4
Figure 4
Detection of the expression levels of TaDrSR1 and TaDrSR2 in the corresponding knock-down plants. (A) The relative expression levels of the TaDrSR1 gene in the TaDrSR1-knock-down plants of variety XN979. (B) The relative expression levels of the TaDrSR2 gene in the TaDrSR2-knock-down plants of variety XN979. (C) The relative expression levels of the TaDrSR1 gene in the TaDrSR1-knock-down plants of variety ZM9023. (D) The relative expression levels of the TaDrSR2 gene in the TaDrSR2-knoc- down plants of variety ZM9023; NS, no stress; DS, drought stress. BSMV0, negative control of the virus-induced gene silencing (VIGS) system; BSMVTaDrSR1, TaDrSR1-knock-down plants; BSMVTaDrSR2, TaDrSR2-knock-down plants. Four independent TaDrSR1- and TaDrSR2-knock-down plants were analyzed, respectively. Different letters indicate significant differences at P ≤ 0.01 levels.
Figure 5
Figure 5
The phenotypes of TaDrSR1- and TaDrSR2-knock-down plants. (A) Leaf; (BK) Whole plants; XN979 was selected as the receptor for viral infection in the VIGS experiment; (GK) ZM9023 was selected as the receptor for viral infection in the VIGS experiment. The pot on the left side of each picture represents the no stress (NS) treatment and the pot on the right side represents the drought stress treatment (DS). BSMV0 represents the negative control of VIGS system; BSMVPDS represents the positive control monitoring time course of VIGS; BSMVTaDrSR1 and BSMVTaDrSR2 represent TaDrSR1- and TaDrSR2-knock-down plants, respectively.
Figure 6
Figure 6
The changes in the physiological indices of the TaDrSR1- and TaDrSR2-knock-down plants. (AD) XN979 was selected as the receptor for viral infection in the VIGS experiment; (A) relative water content; (B) rate of relative electrolyte leakage; (C) MDA content; (D) proline content. (EH) ZM9023 was selected as receptor for viral infection in the VIGS experiment; (E) relative water content; (F) rate of relative electrolyte leakage; (G) MDA content; (H) proline content; NS, non-stressed plants; DS, drought-stressed plants; BSMV0, negative control of the VIGS system; BSMVTaDrSR1 and BSMVTaDrSR2, TaDrSR1- and TaDrSR2-knock-down plants, respectively. Each bar shows the mean ± standard errors (SE) for three biological replicates. Different letters indicate significant differences at P ≤ 0.01 levels.

Similar articles

Cited by

References

    1. Ingram J. A food systems approach to researching food security and its interactions with global environmental change. Food Secur. 2011;3:417–431. doi: 10.1007/s12571-011-0149-9. - DOI
    1. Rosegrant M.W., Ringler C., Zhu T. Water for agriculture: Maintaining food security under growing scarcity. Annu. Rev. Environ. Res. 2009;34:205–222. doi: 10.1146/annurev.environ.030308.090351. - DOI
    1. Sinclair T.R. Challenges in breeding for yield increase for drought. Trends Plant Sci. 2011;16:289–293. doi: 10.1016/j.tplants.2011.02.008. - DOI - PubMed
    1. Jiao X., Lyu Y., Wu X., Li H., Cheng L., Zhang C., Yuan L., Jiang B., Rengel Z., Zhang W.J., et al. Grain production versus resource and environmental costs: Towards increasing sustainability of nutrient use in China. J. Exp. Bot. 2016;67:4935–4949. doi: 10.1093/jxb/erw282. - DOI - PubMed
    1. Thomas L. Why Wheat Matters. International Maize and Wheat Improvement Center (CIMMYT) [(accessed on 14 August 2014)];2014 Available online: http://www.cimmyt.org.

Publication types

LinkOut - more resources