Multicenter Study
. 2018 Dec 13;18(1):114.
doi: 10.1186/s12894-018-0428-2.

Systemic analysis of urinary stones from the Northern, Eastern, Central, Southern and Southwest China by a multi-center study

Affiliations
Multicenter Study

Systemic analysis of urinary stones from the Northern, Eastern, Central, Southern and Southwest China by a multi-center study

Rui-Hong Ma et al. BMC Urol. .

Abstract

Background: To provide some basis for the prevention of urinary stones in general population, we did a systemic analysis of urinary stones from Northern, Eastern, Central, Southern and Southwest China by a multi-center study.

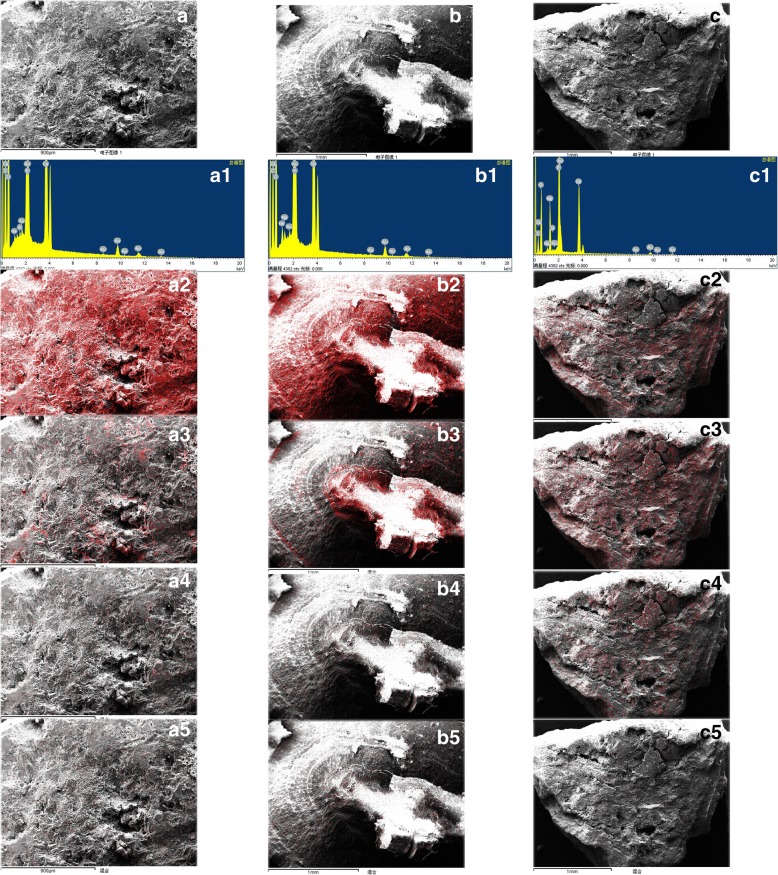
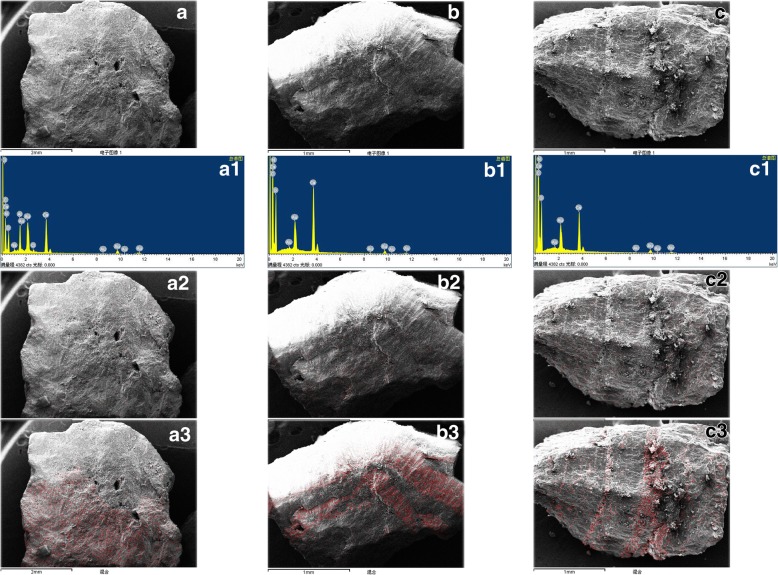
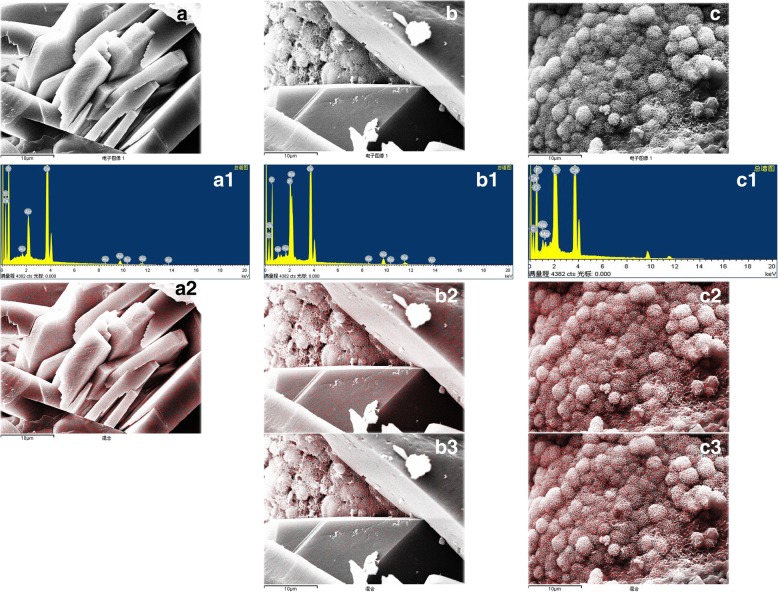
Methods: A total of 11,157 urinary stones from Northern, Eastern, Central, Southern and Southwest China were obtained and analyzed by Fourier transform infrared spectroscopy. Combined with scanning electron microscopy and X-ray energy spectrometer, urinary stones were classified into different types. Furthermore, the correlation between stone types and clinical characteristics, as well as their regional distribution were elucidated.

Results: Calcium oxalate stones were the most common type in each region, followed by calcium oxalate-calcium phosphate mixed stones, uric acid stones and calcium phosphate stones. The distribution of calcium oxalate stones were highest prevalence in Southwest China (67.9%, P < 0.05), followed by Eastern and Northern China. Anhydrous uric acid stones, with a constituent ratio of 19.3% in Southern China, and 13.7% in Central China, were significantly higher than that in other regions (P < 0.05). Elements analysis indicated varieties among stone types as well as distribution regions. Moreover, the clinical characteristics were highly correlated with stone types and anatomical locations but not their distribution regions.

Conclusions: The material and elements composition of urinary stones among different regions showed some varieties. Calcium oxalate stone has the highest constituent ratio in Southwest China, while anhydrous uric acid stone has the highest constituent ratio in Southern China. Moreover, the clinical characteristics were highly correlated with stone types and anatomical locations but not their distribution regions.

Keywords: Calcium oxalate stones; Fourier transform infrared spectroscopy; Regional distribution; Scanning electron microscopy; Uric acid stones; Urinary stones; X-ray energy spectrometer.


Conflict of interest statement

Ethics approval and consent to participate

The sample collection procedures were explained to all patients. Written informed consent was obtained from all patients. The principles outlined in the Declaration of Helsinki of 1975 (revised in 1983 and 1989) were followed throughout the study period. The study was approved by both the Ethics Committee of The Sixth People’s Hospital of Nansha, Guangzhou (reference number is No: 20130821057P) and the Ethics Committee of The Kingmed Diagnostics Center of Guangzhou (KM20130149).

Consent for publication

Not applicable.

Competing interests

The authors have declared that no competing interests exist.

Publisher’s Note

Springer Nature remains neutral with regard to jurisdictional claims in published maps and institutional affiliations.

Figures

Fig. 1
Fig. 1
Element distribution in general stones (the red dot represented element distribution). a calcium oxalate stones with micro dishes of calcium phosphate: calcium oxalate crystals were distributed in the outer layer and profile, with micro dishes of calcium phosphate crystals in the core. A1.The energy spectrum, A2. Calcium distribution, A3. Phosphorus distribution, A4. Magnesium distribution, A5. Natrium distribution; b calcium oxalate-calcium phosphate mixed stones: calcium oxalate crystals were distributed in the outer layer, calcium phosphate crystals were in the core. B1. The energy spectrum, B2. Calcium distribution, B3. Phosphorus distribution, B4. Aluminum distribution, B5. Natrium distribution; c Calcium phosphate stones: a small amount of ammonium magnesium phosphate crystals were scattered in the profile. C1. The energy spectrum, C2. Calcium distribution, C3. Phosphorus distribution, C4. Magnesium distribution, C5. Aluminum distribution
Fig. 2
Fig. 2
Element distribution in general stones: uric acid stones mixed with some calcium oxalate crystals (the red dot represented element distribution). a Uric acid- calcium oxalate mixed stones: uric acid crystals were distributed in the outer layer, and calcium oxalate crystals in the core. A1. The energy spectrum, A2. Nitrogen distribution, A3. Calcium distribution; b Calcium oxalate - uric acid mixed stones: calcium oxalate crystals were distributed in the outer layer, and uric acid crystals in the core. B1. The energy spectrum, B2. Nitrogen distribution, B3. Calcium distribution; c Uric acid stones mixed with micro dishes of calcium oxalate crystals: uric acid crystals were distributed in circular layer, and calcium oxalate crystals were scattered between the layers: C1. The energy spectrum, C2. Nitrogen distribution, C3. Calcium distribution
Fig. 3
Fig. 3
Calcium and phosphorus distribution in calcium oxalate and calcium phosphate crystals (the red dot represented element distribution). a calcium oxalate crystals: A1. The energy spectrum, A2. Calcium distribution; b Calcium oxalate- calcium phosphate mixed crystals: B1. The energy spectrum, B2. Calcium distribution, B3. Phosphorus distribution; c Calcium phosphate crystals: C1. The energy spectrum, C2. Calcium distribution, C3. Phosphorus distribution
Fig. 4
Fig. 4
Nitrogen and calcium distribution in uric acid and uric acid- calcium oxalate mixed crystals (the red dot represented element distribution). a Uric acid crystals: A1. The energy spectrum, A2. Nitrogen distribution; b Uric acid- calcium oxalate mixed crystals: B1. The energy spectrum, B2. Nitrogen distribution, B3. Calcium distribution

References

    1. Ramello A, Vitale C, Marangella M. Epidemiology of nephrolithiasis. J Nephrol. 2000;S(3):S45–S50. - PubMed
    1. Alaya A, Nouri A, Belgith M, Saad H, Jouini R, Najjar MF. Changes in urinary stone composition in the Tunisian population: a retrospective study of 1,301 cases. Ann Lab Med. 2012;32(3):177–183. doi: 10.3343/alm.2012.32.3.177. - DOI - PMC - PubMed
    1. Zeng Q, He Y. Age-specific prevalence of kidney stones in Chinese urban inhabitants. Urolithiasis. 2013;41:91–93. doi: 10.1007/s00240-012-0520-0. - DOI - PubMed
    1. Romero V, Akpinar H, Assimos DG. Kidney stones: a global picture of prevalence, incidence, and associated risk factors. Rev Urol. 2010;12:e86–e96. - PMC - PubMed
    1. Ning X, Zhan C, Yang Y, Yang L, Tu J, Gu H, et al. Secular trends in prevalence of overweight and obesity among adults in rural Tianjin, China from 1991 to 2011: a population-based study. PLoS One. 2014;9:e116019. doi: 10.1371/journal.pone.0116019. - DOI - PMC - PubMed

Publication types

LinkOut - more resources