. 2018 Dec 18;72(24):3142-3154.
doi: 10.1016/j.jacc.2018.09.066.

Associations of Body Mass and Fat Indexes With Cardiometabolic Traits

Affiliations

Associations of Body Mass and Fat Indexes With Cardiometabolic Traits

Joshua A Bell et al. J Am Coll Cardiol. .

Abstract

Background: Body mass index (BMI) is criticized for not distinguishing fat from lean mass and ignoring fat distribution, leaving its ability to detect health effects unclear.

Objectives: The aim of this study was to compare BMI with total and regional fat indexes from dual-energy x-ray absorptiometry in their associations with cardiometabolic traits. Duration of exposure to and change in each index across adolescence were examined in relation to detailed traits in young adulthood.

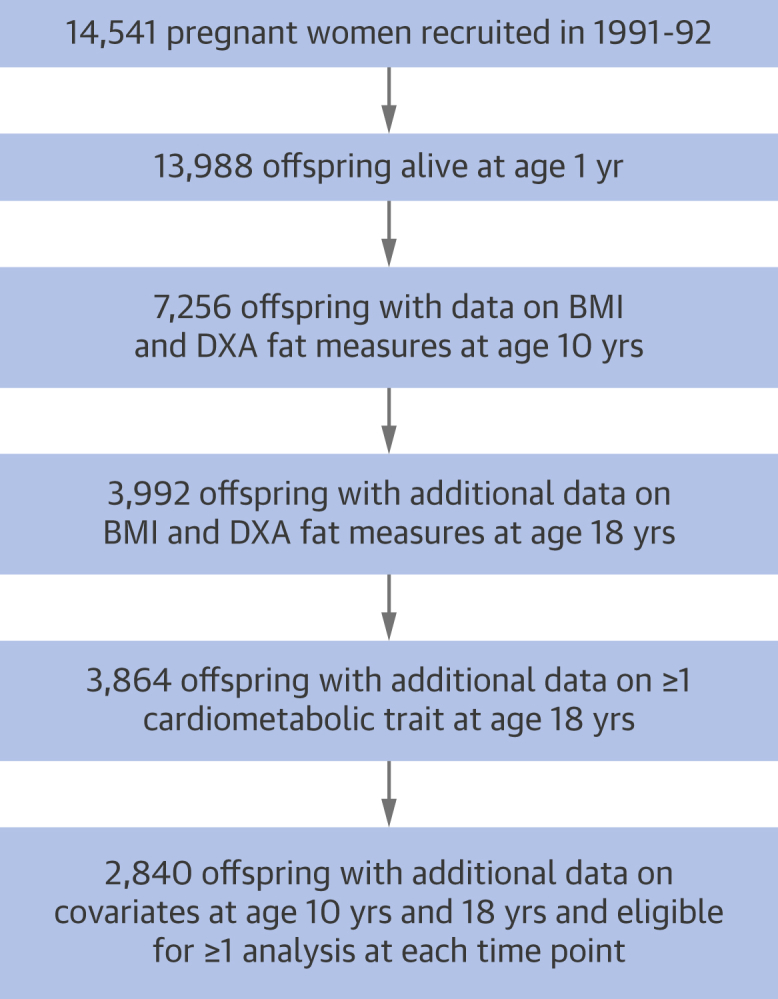
Methods: BMI was examined alongside total, trunk, arm, and leg fat indexes (each in kilograms per square meter) from dual-energy x-ray absorptiometry at ages 10 and 18 years in relation to 230 traits from targeted metabolomics at age 18 years in 2,840 offspring from the Avon Longitudinal Study of Parents and Children.

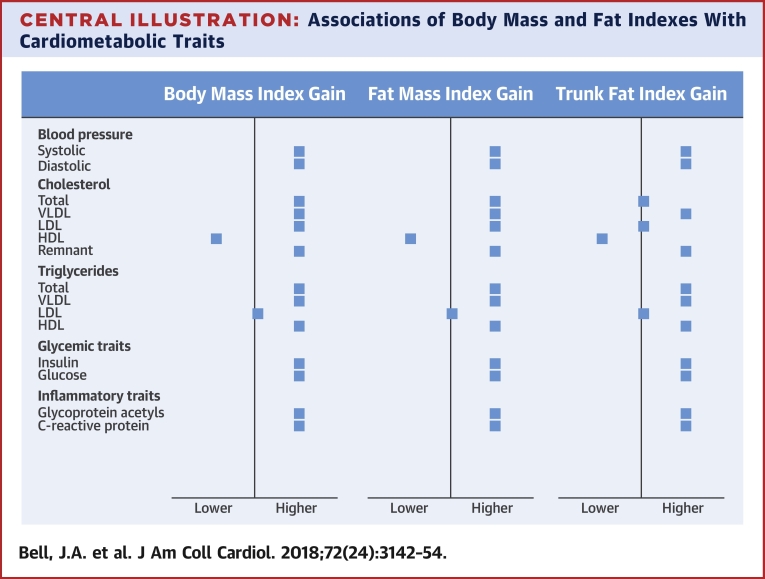
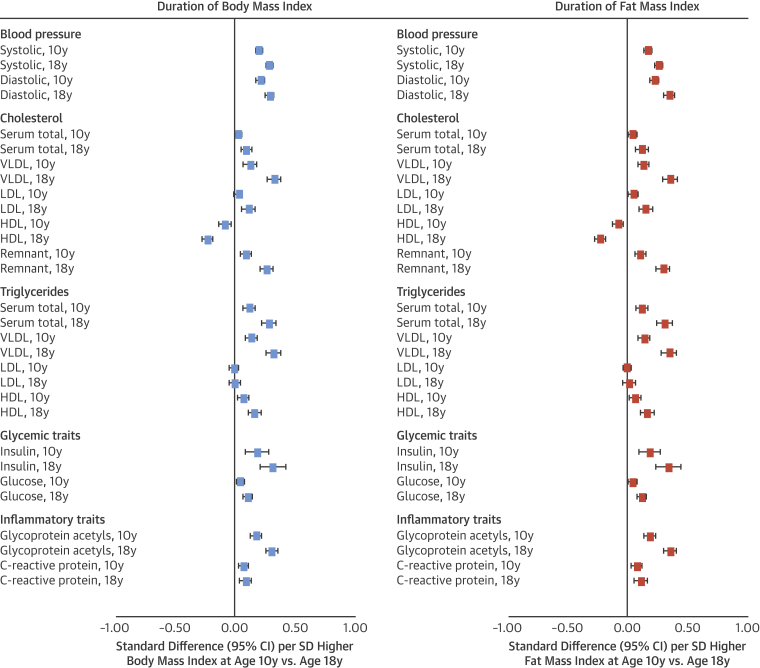
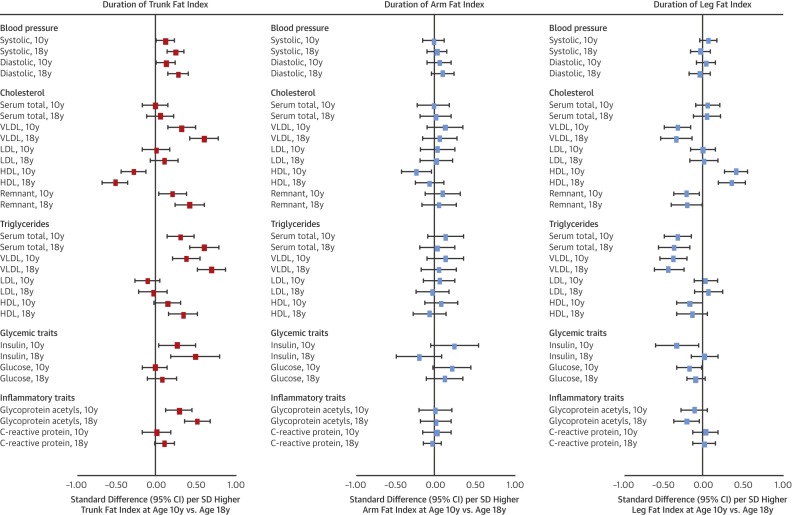
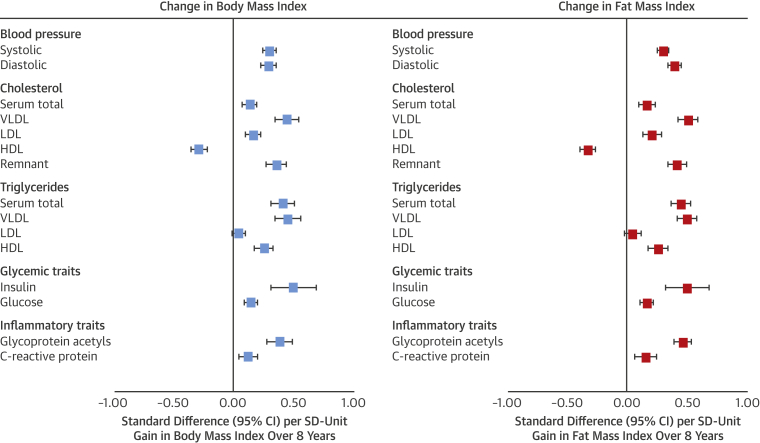
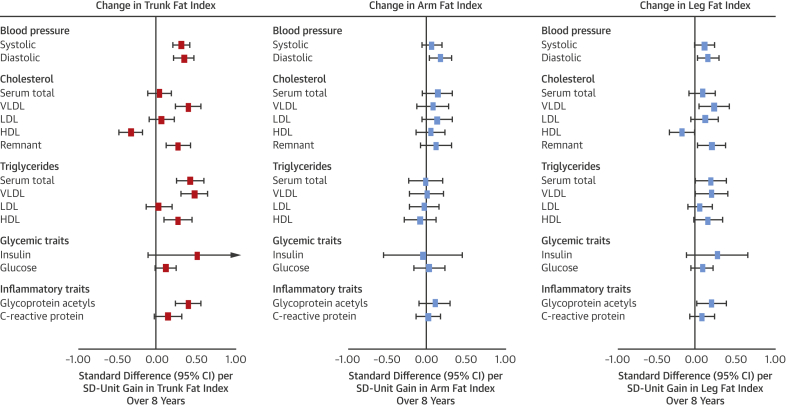
Results: Higher total fat mass index and BMI at age 10 years were similarly associated with cardiometabolic traits at age 18 years, including higher systolic and diastolic blood pressure, higher very low-density lipoprotein and low-density lipoprotein cholesterol, lower high-density lipoprotein cholesterol, higher triglycerides, and higher insulin and glycoprotein acetyls. Associations were stronger for both indexes measured at age 18 years and for gains in each index from age 10 to 18 years (e.g., 0.45 SDs [95% confidence interval: 0.38 to 0.53] in glycoprotein acetyls per SD unit gain in fat mass index vs. 0.38 SDs [95% confidence interval: 0.27 to 0.48] per SD unit gain in BMI). Associations resembled those for trunk fat index. Higher lean mass index was weakly associated with traits and was not protective against higher fat mass index.

Conclusions: The results of this study support abdominal fatness as a primary driver of cardiometabolic dysfunction and BMI as a useful tool for detecting its effects.

Keywords: ALSPAC; DXA; body mass index; cardiometabolic traits; epidemiology.


Figures

None
Graphical abstract
Figure 1
Figure 1
Selection of Participants From the Avon Longitudinal Study of Parents and Children Offspring Cohort Eligible for ≥1 Analysis at Each Time Point Participants described are those with data on body mass index (BMI) and dual-energy x-ray absorptiometry (DXA) fat indexes at 10 and 18 years of age, plus ≥1 cardiometabolic trait at age 18 years, plus covariates. Main analyses of duration (age at measurement comparisons) and change had varying sample sizes ranging from 1,997 to 3,583 participants and were repeated on a complete-case sample of 1,722 participants with data on all variables for comparison.
Figure 2
Figure 2
Duration of Exposure to Body Mass Index and Fat Mass Index in Relation to Blood Pressure, Cholesterol, Triglycerides, and Glycemic and Inflammatory Traits at Age 18 Years in the Avon Longitudinal Study of Parents and Children All outcomes are at age 18 years (“10y” and “18y” noted within outcome list refer to time of body mass index [BMI] or fat mass index measurement). Models for age 10 years exposures are adjusted for age (in months), sex, ethnicity, and maternal education. Models for age 18 years exposures are additionally adjusted for smoking, alcohol, and puberty timing. Estimates are standardized beta coefficients from linear regression models and are interpreted as the number of SDs from the mean of the outcome distribution per SD higher BMI or fat mass index. CI = confidence interval; HDL = high-density lipoprotein; LDL = low-density lipoprotein; VLDL = very-low-density lipoprotein.
Figure 3
Figure 3
Duration of Exposure to Regional Fat Indexes in Relation to Blood Pressure, Cholesterol, Triglycerides, and Glycemic and Inflammatory Traits at Age 18 Years in the Avon Longitudinal Study of Parents and Children All outcomes are at age 18 years (“10y” and “18y” noted within outcome list refer to time of regional fat index measurement). Models for age 10 years exposures are adjusted for age (in months), sex, ethnicity, maternal education, and alternative regional fat measures. Models for age 18 years exposures are additionally adjusted for smoking, alcohol, and puberty timing. Estimates are standardized beta coefficients from linear regression models and are interpreted as the number of SDs from the mean of the outcome distribution per SD higher regional fat index. Abbreviations as in Figure 2.
Figure 4
Figure 4
Change in Body Mass Index and Fat Mass Index From 10 to 18 Years of Age in Relation to Blood Pressure, Cholesterol, Triglycerides, and Glycemic and Inflammatory Traits at Age 18 Years in the Avon Longitudinal Study of Parents and Children Models are adjusted for age (in months) at age 10 years, sex, ethnicity, maternal education, and BMI or fat mass index at age 10 years. Estimates are standardized beta coefficients from linear regression models and are interpreted as number of SDs from the mean of the outcome distribution per SD unit gain in BMI or fat mass index. Abbreviations as in Figure 2.
Figure 5
Figure 5
Change in Regional Fat Indexes From 10 to 18 Years of Age in Relation to Blood Pressure, Cholesterol, Triglycerides, and Glycemic and Inflammatory Traits at Age 18 Years in Avon Longitudinal Study of Parents and Children Models are adjusted for age (in months) at age 10 years, sex, ethnicity, maternal education, change in alternative regional fat indexes from 10 to 18 years of age, and regional fat index exposure at age 10 years. Estimates are standardized beta coefficients from linear regression models and are interpreted as the number of SDs from the mean of the outcome distribution per SD unit gain in regional fat index. Abbreviations as in Figure 2.
Central Illustration
Associations of Body Mass and Fat Indexes With Cardiometabolic Traits Gains in body mass index and dual-energy x-ray absorptiometry–derived total and regional (trunk, arm, leg) fat indexes from 10 to 18 years of age were examined in relation to cardiometabolic traits from clinical assessments and targeted metabolomics at age 18 years among 2,840 offspring from the ALSPAC (Avon Longitudinal Study of Parents and Children) cohort. Models were adjusted for age, sex, ethnicity, maternal education, and index level at age 10 years. Trunk fat index gain was additionally adjusted for change in arm and leg fat indexes. Associations were similar in direction and magnitude for the 3 indexes shown and were weaker for gains in arm and leg fat indexes. HDL = high-density lipoprotein; LDL = low-density lipoprotein; VLDL = very-low-density lipoprotein.

Comment in

References

    1. NCD Risk Factor Collaboration Trends in adult body-mass index in 200 countries from 1975 to 2014: a pooled analysis of 1698 population-based measurement studies with 19· 2 million participants. Lancet. 2016;387:1377–1396. - PMC - PubMed
    1. Flegal K.M., Shepherd J.A., Looker A.C. Comparisons of percentage body fat, body mass index, waist circumference, and waist-stature ratio in adults. Am J Clin Nutr. 2009;89:500–508. - PMC - PubMed
    1. Romero-Corral A., Somers V.K., Sierra-Johnson J. Accuracy of body mass index in diagnosing obesity in the adult general population. Int J Obes. 2008;32:959–966. - PMC - PubMed
    1. Würtz P., Wang Q., Kangas A.J. Metabolic signatures of adiposity in young adults: Mendelian randomization analysis and effects of weight change. PLoS Med. 2014;11:e1001765. - PMC - PubMed
    1. Dale C.E., Fatemifar G., Palmer T.M. Causal associations of adiposity and body fat distribution with coronary heart disease, stroke subtypes, and type 2 diabetes mellitus. Circulation. 2017;135:2373–2388. - PMC - PubMed

Publication types