. 2019 Jan 16;101(2):260-273.e6.
doi: 10.1016/j.neuron.2018.11.028. Epub 2018 Dec 10.

CaV2.1 α1 Subunit Expression Regulates Presynaptic CaV2.1 Abundance and Synaptic Strength at a Central Synapse

Affiliations

CaV2.1 α1 Subunit Expression Regulates Presynaptic CaV2.1 Abundance and Synaptic Strength at a Central Synapse

Matthias Lübbert et al. Neuron. .

Abstract

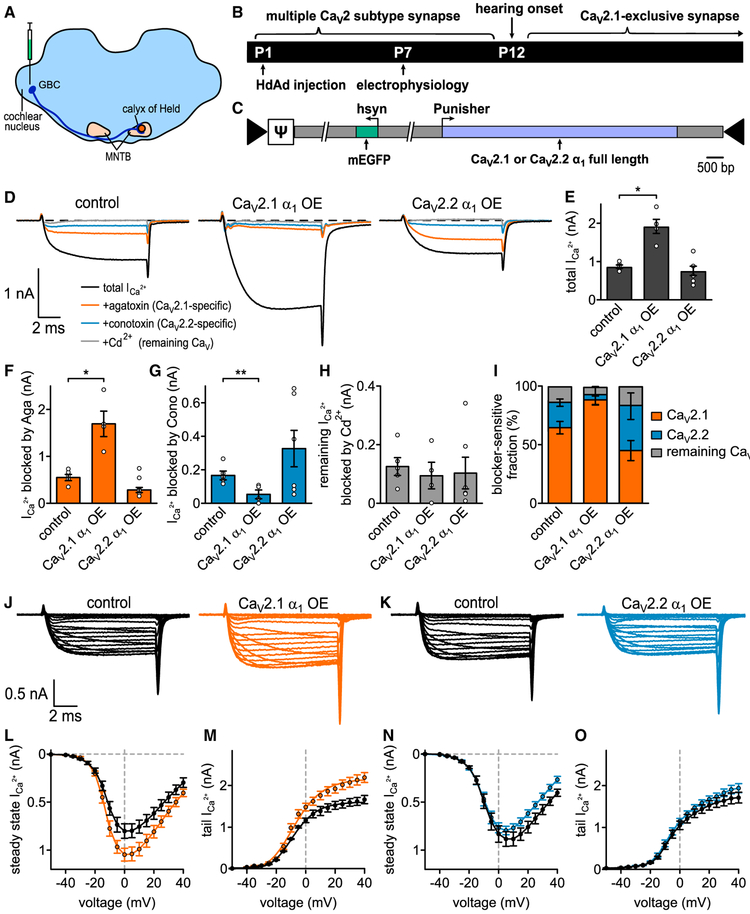
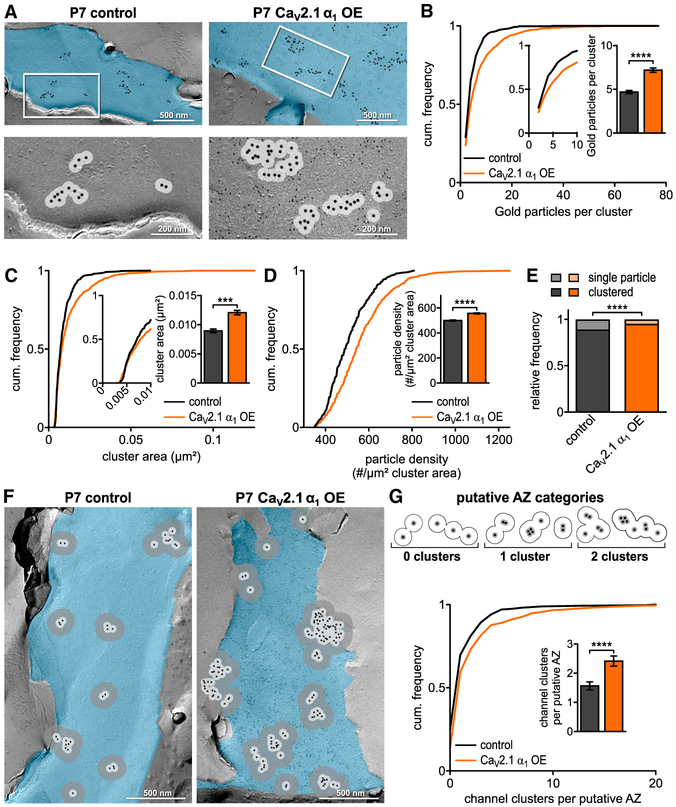
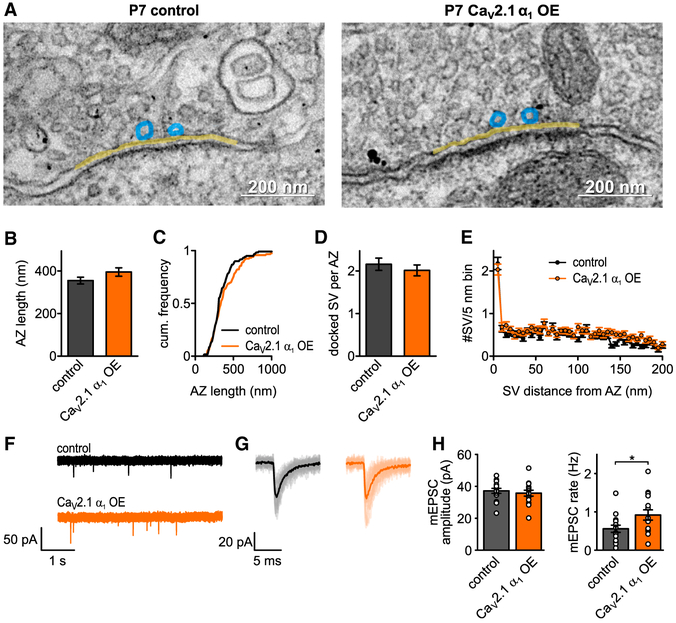
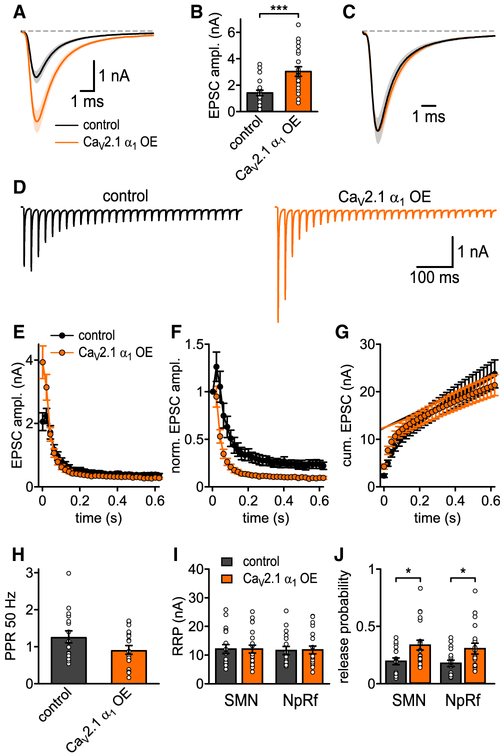
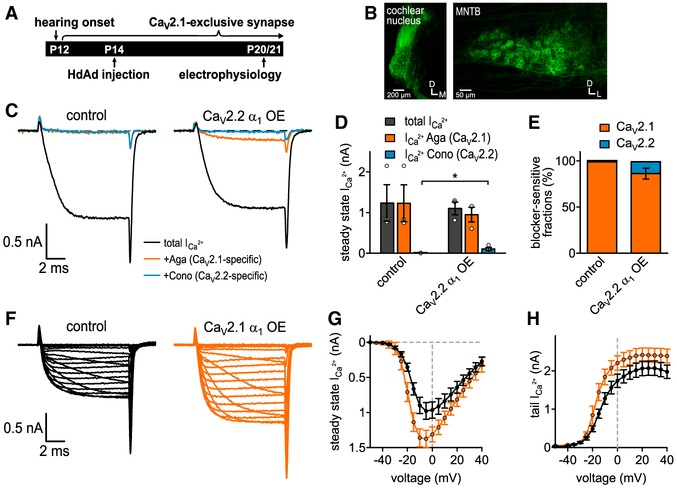
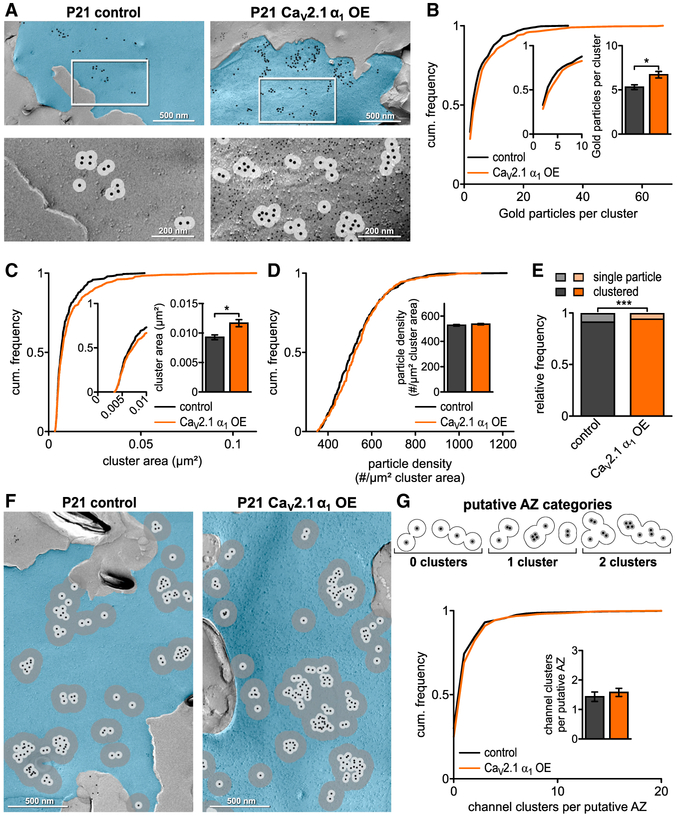
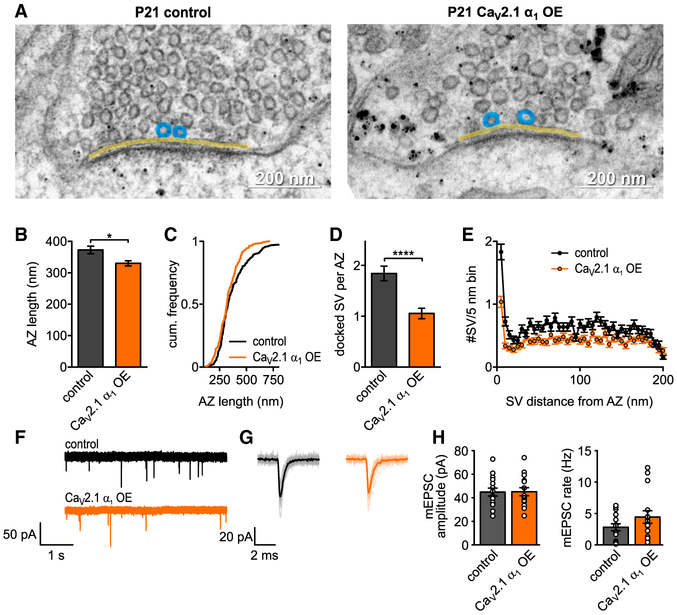
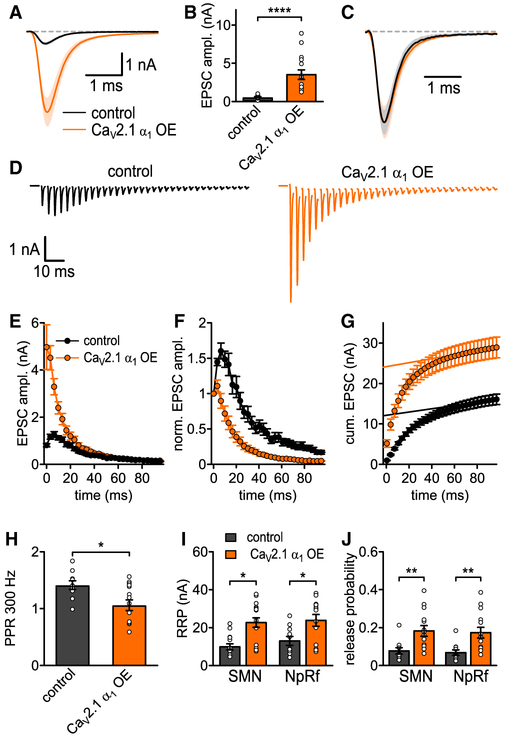
The abundance of presynaptic CaV2 voltage-gated Ca2+ channels (CaV2) at mammalian active zones (AZs) regulates the efficacy of synaptic transmission. It is proposed that presynaptic CaV2 levels are saturated in AZs due to a finite number of slots that set CaV2 subtype abundance and that CaV2.1 cannot compete for CaV2.2 slots. However, at most AZs, CaV2.1 levels are highest and CaV2.2 levels are developmentally reduced. To investigate CaV2.1 saturation states and preference in AZs, we overexpressed the CaV2.1 and CaV2.2 α1 subunits at the calyx of Held at immature and mature developmental stages. We found that AZs prefer CaV2.1 to CaV2.2. Remarkably, CaV2.1 α1 subunit overexpression drove increased CaV2.1 currents and channel numbers and increased synaptic strength at both developmental stages examined. Therefore, we propose that CaV2.1 levels in the AZ are not saturated and that synaptic strength can be modulated by increasing CaV2.1 levels to regulate neuronal circuit output. VIDEO ABSTRACT.

Keywords: Ca(V)2.1; active zone; calcium channels; calyx of Held; neuronal circuits; release probability; synaptic plasticity; synaptic strength; synaptic transmission; viral vectors.


Figures

Figure 1.
Figure 1.. CaV2.1 α1 OE Results in Increased CaV2.1 Currents and Almost Complete Loss of CaV2.2 Currents at the P7 Calyx
(A) Schematic of auditory brainstem. Globular bushy cells (GBC) which give rise to the calyx of Held are depicted for clarity. (B) (Top) Developmental transition of calyx of Held from multiple CaV2 subtype synapse to CaV2 exclusive at onset of hearing (P12). (Bottom) Experimental timeline from virus injection into VCN at P1 to electrophysiological recordings at P7. (C) Schematic of HdAd constructs expressing either CaV2.1 or CaV2.2 cDNAs (light blue) driven by the Punisher overexpression cassette and mEGFP marker (green) driven by a 470 bp human synapsin promoter; arrows indicate viral inverted terminal repeat sequences; J indicates the viral genome packaging signal sequence. (D) Pharmacological isolation of CaV2 isoforms expressed in the presynaptic terminal at P7 in control (n = 5), CaV2.1 α1 OE (n = 4), or CaV2.2 α1 OE (n = 6). Average traces before application of blockers (black), after applying 200 nM ω-agatoxin IVA to specifically block CaV2.1 (Aga, brown), after 2 μM ω-conotoxin GVIA to block CaV2.2 (Cono, blue) and 50 μM Cd2+ to block the remaining Ca2+ currents (gray). (E–H) Ca2+ current amplitudes before blocker application (CaV2.1 α1 OE versus control, p = 0.0328 Mood’s median test and post hoc Bonferroni test), Aga-sensitive Ca2+ current amplitudes (CaV2.1 α1 OE versus control, p = 0.0328), Cono-sensitive Ca2+ current amplitudes (CaV2.1 α1 OE versus control, p = 0.0054), and Cd2+-sensitive Ca2+ current amplitudes (n.s., Kruskal Wallis and post hoc Dunn’s test, n = 5/4/6 for control, CaV2.1 α1 OE, and CaV2.2 α1 OE, respectively). (I) Relative Ca2+ current fractions sensitive to respective blockers. (J and K) Average Ca2+ current traces to 10 ms step depolarizations from −80 mV holding to voltages between −50 and +40 mV for control (J and K, left, black) and CaV2.1 α1 OE (J, right, brown) or CaV2.2 α1 OE (K, right, blue). (L–O) Current-voltage relationships of either steady-state Ca2+ currents (L and N) or tail Ca2+ currents (M and O, n = 10 for control, CaV2.1 α1 OE and CaV2.2 α1 OE). All data are shown as mean ± SEM. See also Table S1.
Figure 2.
Figure 2.. CaV2.1 α1 OE Leads to Increase in CaV2.1 Channels and Clusters at Putative AZ at P7
(A) Representative SDS-digested freeze-fracture immunogold-labeled replicas of calyx P-faces (pseudocolored blue) of control and CaV2.1 α1 OE at P7. (Top) CaV2.1 distribution. Large gold particles (12 nm) label CaV2.1, small gold particles (6 nm) label mEGFP (CaV2.1 α1 OE only). (Bottom) High-magnification images of the boxed areas showing clustering of gold particles. A 30 nm circle indicates spatial uncertainty of CaV2.1 (light gray). Note that 12 nm gold particles have been enhanced for better visibility. (B) Cumulative frequency distribution of gold particles per cluster; (insets) closeup of 0–10 particle clusters and corresponding bar graph (p < 0.0001, Mann-Whitney U test, n = 428 for control and n = 957 for CaV2.1 α1 OE). (C) Cumulative frequency distribution of cluster area; (inset) closeup of 0–0.01 μm2 and corresponding bar graph (p = 0.0006, Mann-Whitney U test, n = 428 for control and n = 957 for CaV2.1 α1 OE). (D) Cumulative frequency distribution of gold particle density per μm2 cluster area; (inset) bar graph (p < 0.0001, Mann-Whitney U test, n = 428 for control and n = 957 for CaV2.1 α1 OE). (E) Relative frequency of single channels to channel clusters at P7 (p < 0.0001, Fisher’s exact test, n = 2,290 particles in 8 replicas for control and n = 7,314 particles in 7 replicas for CaV2.1 α1 OE). (F) Representative SDS-digested freeze-fracture immunogold-labeled replicas of calyx P-faces (blue) of control and CaV2.1 α1 OE. Light gray circles indicate 30 nm radius, and dark gray circles indicate 100 nm radius around gold particles. (G) (Top) Scheme of putative AZ categories. Cluster defined as overlap of at least two 30 nm circles and putative AZ as overlap of all 100 nm circles of clusters. (Bottom) Cumulative frequency distribution of channel cluster assembly within a putative AZ. (Inset) Number of clusters per putative AZ (p < 0.0001, Mann-Whitney U test, n = 271 for control and n = 390 for CaV2.1 α1 OE). All data are shown as mean ± SEM. EM images are montage of multiple images assembled from the calyx P-face area containing CaV2.1. See also Table S2.
Figure 3.
Figure 3.. CaV2.1 α1 OE Does Not Affect AZ Ultrastructure or Quantal Size at P7
(A–C) Representative EM images depicting AZs (yellow line) and docked SV (blue circles) of control (left) or CaV2.1 α1 OE (right) calyces. Transduced terminals are identified by antibody-coupled gold nanoparticles directed against EGFP (black dots in right image). (B and C) AZ length (B, n.s., Mann-Whitney U test, n = 120 for control and n = 118 for CaV2.1 α1 OE), cumulative frequency of AZ length (C). (D) Number of docked vesicles per AZ (n.s., Mann-Whitney U test). (E) SV distribution up to 200 nm distance from AZ in 5 nm bins. (F) Representative traces of mEPSC recordings. (G) Averaged mEPSCs for representative cell in (F). (H) Average mEPSC amplitude (left, p = 0.56, two-tailed t test, n = 15) and mEPSC rate (right, p = 0.04, two-tailed t test). All data are shown as mean ± SEM. See also Table S2.
Figure 4.
Figure 4.. Increased CaV2.1 Levels at AZ Increase SV Release Probability at P7
(A) Average basal EPSC. (B) EPSC peak amplitudes (p = 0.0006, Mann-Whitney U test, n = 20 for control and CaV2.1 α1 OE). (C) Basal EPSC normalized to peak. (D) Average traces of 50 Hz EPSC trains for control (left, n = 17) and CaV2.1 α1 OE (right, n = 20). (E) 50 Hz train EPSC absolute peak amplitudes. (F) 50 Hz train EPSC peak amplitudes normalized to first EPSC. (G) Cumulative EPSC amplitudes. (H) 50 Hz paired-pulse ratio (PPR, n.s., t test). (I) RRP quantified with corrected SMN and NpRf methods (n.s., Mann-Whitney U test, n = 17 for control and n = 20 for CaV2.1 α1 OE). (J) Release probability Pr quantified with corrected SMN and NpRf methods (p = 0.033 and p = 0.045, respectively, Mann-Whitney U test). All data are shown as mean ± SEM. See also Table S3.
Figure 5.
Figure 5.. CaV2.2 α1 OE Results in Slight Loss of CaV2.1 Currents, while CaV2.1 α1 OE Results in an Increase in CaV2.1 Currents at P20/21 Calyx
(A) Experimental timeline from virus injection into CN at P14 to electrophysiological recordings at P20/21. (B) Confocal images of brainstem slices injected with CaV2.1 α1 OE construct. (Left) CN injection site. (Right) Contralateral MNTB with mEGFP-expressing calyx of Held terminals. (C) Pharmacological isolation of CaV2 isoforms expressed in the presynaptic terminal at P21 in control (n = 3) and CaV2.2 α1 OE (n = 3). Average current traces before application of blockers (black), after applying 200 nM ω-agatoxin IVA to specifically block CaV2.1 (Aga, brown) and after applying 2 μM ω-conotoxin GVIA to specifically block CaV2.2 (Cono, blue). (D) Ca2+ current amplitudes before blocker application (black, n.s., two-tailed t test), Aga-sensitive Ca2+ current amplitudes (brown, n.s., one-tailed t test), and Cono-sensitive Ca2+ current amplitudes (blue, 0.016, one-tailed t test). (E) Relative Ca2+ current fractions sensitive to blockers. (F) Average Ca2+-current traces to 10 ms step depolarizations from −80 mV holding to voltages between −50 and +40 mV for control (left, n = 9) and CaV2.1 α1 OE (right, n = 10). (G and H) Current-voltage relationships of either peak Ca2+ currents (G) or tail Ca2+ currents (H). All data are shown as mean ± SEM. See also Table S4.
Figure 6.
Figure 6.. CaV2.1 α1 OE Increases CaV2.1 Channels and Cluster Area at the Putative AZ at P21 Calyx
(A) Representative SDS-digested freeze-fracture immunogold labeled replicas of calyx P-faces (pseudocolored blue) of control and CaV2.1 α1 OE at P21. (Top) CaV2.1 distribution. Large gold particles (12 nm) label CaV2.1, small gold particles (6 nm) label mEGFP (CaV2.1 α1 OE only), and 30 nm circle indicates spatial uncertainty of CaV2.1 (light gray). (Bottom) High-magnification images of the boxed areas showing clustering of gold particles. Note that 12 nm gold particles have been enhanced for better visibility. (B) Cumulative frequency distribution of gold particles per cluster; (insets) closeup of 0–10 particle clusters and corresponding bar graph (p = 0.0139, Mann-Whitney U test, n = 334 for control and n = 456 for CaV2.1 α1 OE). (C) Cumulative frequency distribution of cluster area; (inset) closeup of 0–0.01 μm2 and corresponding bar graph (p = 0.0315, Mann-Whitney U test). (D) Cumulative frequency distribution of gold particle density per μm2 cluster area; (inset) bar graph (p = 0.1080, Mann-Whitney U test). (E) Relative frequency of single channels to channel clusters (p = 0.0003, Fisher’s exact test, n = 1,982 particles in 13 replicas for control and n = 3,307 particles in 10 replicas for CaV2.1 α1 OE). (F) Representative SDS-digested freeze-fracture immunogold labeled replicas of calyx P-faces (blue) of control and CaV2.1 α1 OE at P21. Large gold particles (12 nm) label CaV2.1, small gold particles (6 nm) label mEGFP (control and CaV2.1 α1 OE only), 30 nm circle (light gray), and 100 nm circle (dark gray). (G) (Top) Diagram of putative AZ categories. Cluster defined as overlap of at least two 30 nm circles and putative AZ as overlap of all 100 nm circles of clusters. (Bottom) Cumulative frequency distribution of channel cluster assembly within a putative AZ. (Inset) Number of clusters per putative AZ (p = 0.0663, Mann-Whitney U test, n = 230 for control and n = 285 for CaV2.1 α1 OE). All data are shown as mean ± SEM. EM images are a montage of multiple images assembled from the calyx P face area containing CaV2.1. See also Table S5.
Figure 7.
Figure 7.. CaV2.1 α1 OE Affects Presynaptic Ultrastructure without Affecting Quantal Size at P21
(A) Representative EM images depicting AZs (yellow line) and docked SV (blue circles) of control (left) or CaV2.1 α1 OE (right) calyces. Transduced terminals identified by antibody-coupled gold nanoparticles directed against EGFP (black dots). (B and C) AZ length (B, p = 0.0339, Mann-Whitney U test, n = 160 for control and CaV2.1 α1 OE), cumulative frequency of AZ length (C). (D) Number of docked vesicles per AZ (p < 0.0001, Mann-Whitney U test). (E) SV distribution up to 200 nm distance from AZ in 5 nm bins. (F) Representative traces of mEPSC recordings. (G) Averaged mEPSC recordings for representative cell in (F). (H) Average mEPSC amplitude (left, p = 0.95, two-tailed t test, n = 15) and mEPSC rate (right, p = 0.35, Mann-Whitney U test). All data are shown as mean ± SEM. See also Table S5.
Figure 8.
Figure 8.. Increased CaV2.1 Levels at AZs Increase Pr and RRP Size at P20/21 Calyx
(A) Average basal EPSC. (B) EPSC peak amplitudes (p < 0.0001, Mann-Whitney U test, n = 10 for control and n = 15 for CaV2.1 α1 OE). (C) Basal EPSC normalized to peak. (D) Average 300 Hz EPSC trains for control (left, n = 10) and CaV2.1 α1 OE (right, n = 14). (E) 300 Hz train EPSC peak amplitudes. (F) 300 Hz train EPSC absolute peak amplitudes normalized to first EPSC. (G) Cumulative EPSC amplitudes. (H) 300 Hz paired-pulse ratio (PPR, p = 0.04, t test). (I) RRP quantified with corrected SMN and NpRf methods (p = 0.0109 and p = 0.0177, respectively, Mann-Whitney U test, n = 10 for control and n = 14 for CaV2.1 α1 OE). (J) Release probability Pr quantified with corrected SMN and NpRf methods (p = 0.0024 and p = 0.0067, respectively, Mann-Whitney U test). All data are shown as mean ± SEM. See also Table S6.

References

    1. Althof D, Baehrens D, Watanabe M, Suzuki N, Fakler B, and Kulik Á (2015). Inhibitory and excitatory axon terminals share a common nano-architecture of their Cav2.1 (P/Q-type) Ca(2+) channels. Front. Cell. Neurosci. 9, 315. - PMC - PubMed
    1. Ariel P, Hoppa MB, and Ryan TA (2013). Intrinsic variability in Pv, RRP size, Ca(2+) channel repertoire, and presynaptic potentiation in individual synaptic boutons. Front. Synaptic Neurosci. 4, 9. - PMC - PubMed
    1. Basu J, Betz A, Brose N, and Rosenmund C (2007). Munc13-1 C1 domain activation lowers the energy barrier for synaptic vesicle fusion. J. Neurosci. 27, 1200–1210. - PMC - PubMed
    1. Baur D, Bornschein G, Althof D, Watanabe M, Kulik A, Eilers J, and Schmidt H (2015). Developmental tightening of cerebellar cortical synaptic influx-release coupling. J. Neurosci. 35, 1858–1871. - PMC - PubMed
    1. Belevich I, Joensuu M, Kumar D, Vihinen H, and Jokitalo E (2016). Microscopy Image Browser: a platform for segmentation and analysis of multidimensional datasets. PLoS Biol. 14, e1002340. - PMC - PubMed

Publication types

MeSH terms

LinkOut - more resources