. 2019 Jan 18;363(6424):eaau0629.
doi: 10.1126/science.aau0629. Epub 2018 Dec 13.

CRISPR-mediated activation of a promoter or enhancer rescues obesity caused by haploinsufficiency

Affiliations

CRISPR-mediated activation of a promoter or enhancer rescues obesity caused by haploinsufficiency

Navneet Matharu et al. Science. .

Abstract

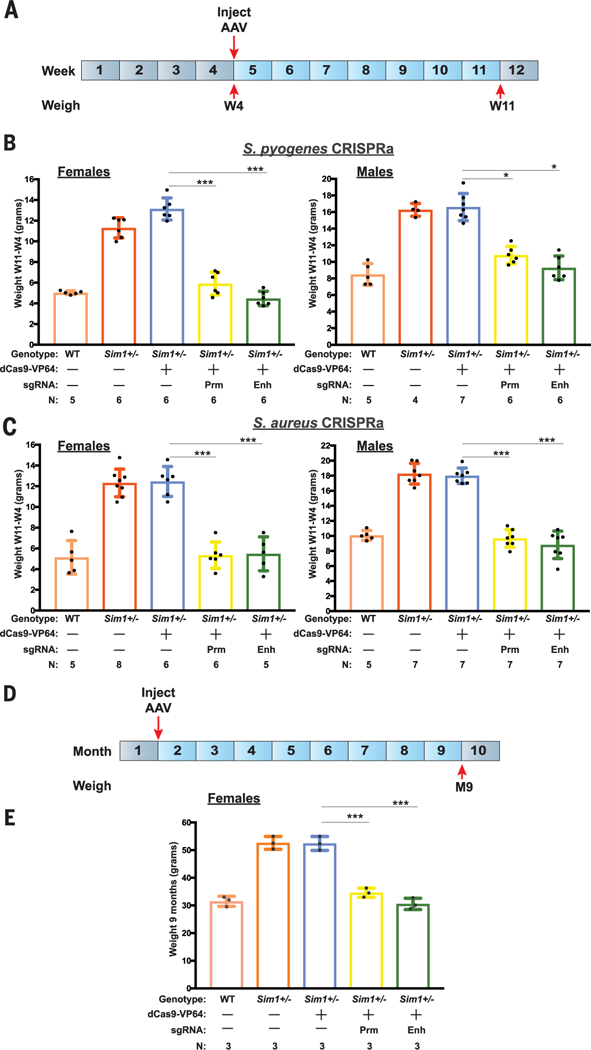
A wide range of human diseases result from haploinsufficiency, where the function of one of the two gene copies is lost. Here, we targeted the remaining functional copy of a haploinsufficient gene using CRISPR-mediated activation (CRISPRa) in Sim1 and Mc4r heterozygous mouse models to rescue their obesity phenotype. Transgenic-based CRISPRa targeting of the Sim1 promoter or its distant hypothalamic enhancer up-regulated its expression from the endogenous functional allele in a tissue-specific manner, rescuing the obesity phenotype in Sim1 heterozygous mice. To evaluate the therapeutic potential of CRISPRa, we injected CRISPRa-recombinant adeno-associated virus into the hypothalamus, which led to reversal of the obesity phenotype in Sim1 and Mc4r haploinsufficient mice. Our results suggest that endogenous gene up-regulation could be a potential strategy to treat altered gene dosage diseases.


Figures

Fig. 1.
Fig. 1.. CRISPRa Sim1 up-regulation in vitro and obesity rescue in vivo.
(A) Schema of the mouse Sim1 genomic locus, showing the LacZ-driven hypothalamic expression of SCE2 (En) from 56-day-old mice. (B) CRISPRa in Neuro-2a cells targeting the Sim1 promoter (Prm-CRISPRa) or enhancer (Enh-CRISPRa). Results are expressed as mRNA fold increase normalized to Actb using the ΔΔCT method. The data are represented as means ± the lower and upper quartile, and lines represent the minimum and maximum from three independent experiments and three technical replicates. *p < 0.001; ***p < 0.0005 (ANOVA, Tukey test). (C) Schema showing the mating scheme used to generate Sim1+/− CRISPRa mice. A CAG-dCas9-VP64 cassette was knocked into the Hipp11 (H11P3) locus, and an sgRNA targeting either the Sim1 promoter (U6-Prm-sgRNA) or SCE2 (U6-Enh-sgRNA) was knocked into the Rosa26 locus. (D) Weekly weight measurements of wild-type, Sim1+/−, H11P3CAG-dCas9-VP64 × R26P3Sim1Pr-sgRNA (Prm-CRISPRa), and H11P3CAG-dCas9-VP64 × R26P3SCE2En-sgRNA (Enh-CRISPRa). At least 10 male and female mice were measured per genotype. Mean values ± SD are shown. p-value statistics are listed in table S5. (E and F) Photos of 26-week-old male mice for each genotype: Sim1+/−, H11P3CAG-dCas9-VP64 × R26P3Sim1Pr-sgRNA (Prm), and wild type (WT) (E) and Sim1+/−, H11P3CAG-dCas9-VP64 × R26P3SCE2En-sgRNA (Enh), and wild type (WT) (F). Genotype, weight, and length of each mouse are depicted below.
Fig. 2.
Fig. 2.. dCas9 and Sim1 mRNA expression levels in CRISPRa transgenic mice.
(A) dCas9 mRNA expression in the hypothalamus, kidney, lung, and liver from four Sim1+/− × H11P3CAG-dCas9-VP64 mice. The data are represented as means ± the lower and upper quartile, and lines represent the minimum and maximum from at least four mice with three technical replicates. (B) Sim1 mRNA expression in the hypothalamus, kidney, lung, and liver for the following genotypes: wild type, Sim1+/−, H11P3CAG-dCas9-VP64 × R26P3Sim1Pr-sgRNA (Prm-CRISPRa), and H11P3CAG-dCas9-VP64 × R26P3SCE2En-sgRNA (Enh-CRISPRa). The data are represented as means ± the lower and upper quartile, and lines represent the minimum and maximum from four mice (two females and two males) and three technical replicates. All experiments were determined based on mRNA fold increase compared to wild type and normalized to Actb or Rpl38 using the ΔΔCT method or ΔCT for (A). BDL, below detectable levels. (C and D) A Michaelis-Menten plot showing differentially expressed genes in the hypothalamus between Sim1+/− and wild-type mice on the x axis and Prm-CRISPRa (C) or Enh-CRISPRa (D) versus Sim1+/− mice on the y axis. The larger circles are genes that are differentially expressed with a raw p value ≤0.05, and the outlined circles have a FDR ≤0.1. (E and F) A Michaelis-Menten plot showing differentially expressed genes in the hypothalamus that are nearby ChlP-seq peaks and predicted off-target sgRNAs between Sim1+/− and wild-type mice on the x axis and Prm-CRISPRa (E) or Enh-CRISPRa (F) versus Sim1+/− mice on the y axis. The outlined circles are genes that show differential expression with a raw p value ≤0.05, and the larger circles are genes that overlap nearby off-target sites (both Sim1 promoter and SCE2 were predicted targets even up to three mismatches).
Fig. 3.
Fig. 3.. CRISPRa Sim1 overexpression in vitro and in vivo by using AAV.
(A) Schema showing the various S. pyogenes and S. aureus AAVs used for Sim1 CRISPRa. (B) S. pyogenes (left) and S. aureus (right) AAV CRISPRa in Neuro-2a cells using virons containing pCMV-dCas9-VP64 (dCas9-VP64), pCMV-dCas9-VP64 along with pSim1Pr-mCherry (Prm-CRISPRa), and pCMV-dCas9-VP64 along with pSCE2En-mCherry (Enh-CRISPRa). Results are expressed as mRNA fold increase normalized to Actb using the ΔΔCT method. The data are represented as means ± the lower and upper quartile, and lines represent the minimum and maximum from four independent experiments with three technical replicates. ***p < 0.0005; **p < 0.001 (ANOVA, Tukey test). (C) Schema showing location of the single midline stereotactic injection in the PVN (red circle) followed by immunohistochemistry results from pSim1Pr-mCherry-injected hypothalami of 12-week-old mice showing DAPI (4′,6-diamidino-2-phenylindole) staining, mCherry expression, and merged staining of both. (D and E) dCas9 (D) and Sim1 (E) mRNA expression from noninjected wild-type and Sim1+/− mice along with pCMV-spdCas9-VP64 (dCas9-VP64)–, pCMV-spdCas9-VP64 + pSim1Pr-mCherry (Prm-CRISPRa)–, and pCMV-spdCas9-VP64 + pSCE2En-mCherry (Enh-CRISPRa)–injected Sim1+/− mice for S. pyogenes. (F and G) dCas9 (F) and Sim1 (G) mRNA expression from noninjected wild-type and Sim1+/− mice along with pCMV-sadCas9-VP64 (dCas9-VP64)–, pCMV-sadCas9-VP64 + pSim1Pr-mCherry (Prm-CRISPRa)–, and pCMV-sadCas9-VP64 + pSCE2En-mCherry (Enh-CRISPRa)–injected Sim1+/− mice for S. aureus. Four mice were used for each genotype. The data are represented as means ± the lower and upper quartile, and lines represent the minimum and maximum. Values from four independent experiments with three technical replicates were determined based on mRNA fold increase compared to wild-type mice and normalized to Actb using the ΔΔCT method for Sim1 expression and relative Actb ΔCT log2 for dCas9 expression.
Fig. 4.
Fig. 4.. CRISPRa-AAV injection in the PVN decreases weight gain in Sim1+/− mice.
(A) Timeline for weight measurement after CRISPRa-AAV injection in PVN. (B and C) Weight gain determined over a 7-week period from Sim1+/− mice injected with pCMV-dCas9-VP64 (dCas9-VP64), pCMV-dCas9-VP64 + pSim1Pr-mCherry (Prm-CRIPSRa), or pCMV-dCas9-VP64 + pSCE2En-mCherry (Enh-CRISPRa) compared to uninjected wild-type littermates and Sim1+/− mice using S. pyogenes (B) or S. aureus (C) CRISPRa. Means ± SD and number of mice (N) are shown per condition. *p < 0.001; ***p < 0.0005; n.s., not significant (ANOVA, Tukey test). (D) Monthly timeline for weight measurement after CRISPRa-AAV injection in PVN. (E) dCas9-VP64, Prm-CRIPSRa, and Enh-CRISPRa compared to uninjected wild-type littermates and Sim1+/− mice 9 months after injection. Means ± SD and number of mice (N) are shown per condition. ***p < 0.0005.
Fig. 5.
Fig. 5.. CRISPRa-AAV injection in the PVN decreases weight gain in Mc4r+/− mice.
(A) Schema showing the CRISPR AAVs used for injection into Mc4r+/− mice. (B) Timeline for weight measurement post CRISPRa-AAV injection in PVN. (C and D) dCas9 (C) and Mc4r (D) mRNA expression from uninjected wild-type and Mc4r+/− mice along with pCMV-sadCas9-VP64 (dCas9-VP64)– and pCMV-sadCas9-VP64 + pMc4rPr-mCherry (Prm-CRISPRa)–injected Mc4r+/− mice. Four mice were used for each genotype with three technical replicates. The data are represented as means ± the lower and upper quartile, and lines represent the minimum and maximum. Values were determined based on mRNA fold increase compared to wild-type mice and normalized to Actb using the ΔΔCT method for Mc4r expression and relative Actb ΔCT log2 for dCas9 expression. (E and F) Weight gain determined over an 8-week period from Mc4r+/− female (E) or male (F) mice injected with pCMV-sadCas9-VP64 (dCas9-VP64) or pCMV-sadCas9-VP64 + pMc4rPr-mCherry (Prm-CRISPRa) compared to uninjected wild-type littermates and Mc4r+/− mice. Means ± SD and number of mice (N) are shown for each condition. ***p < 0.0005; (ANOVA, Tukey test).
Fig. 6.
Fig. 6.. CRISPRa potential therapeutic strategy.
(A) Tissue-specific differences in gene activation due to the type of targeted cis-regulatory element (promoter or enhancer). (B) CRISPRa can be used as a tool to rescue haploinsufficiency by up-regulating the expression of the endogenous functional allele. It can also be used to up-regulate a gene or genes that are deleted in microdeletions or an alternate gene with a function similar to that of the disease-mutated gene.

Comment in

References

    1. Dang VT, Kassahn KS, Marcos AE, Ragan MA, Identification of human haploinsufficient genes and their genomic proximity to segmental duplications. Eur. J. Hum. Genet 16, 1350–1357 (2008). doi: 10.1038/ejhg.2008.111; pmid: 18523451 - DOI - PubMed
    1. Landrum MJ et al., ClinVar: Public archive of interpretations of clinically relevant variants. Nucleic Acids Res. 44, D862–D868 (2016). doi: 10.1093/nar/gkv1222; pmid: 26582918 - DOI - PMC - PubMed
    1. Lek M et al., Analysis of protein-coding genetic variation in 60,706 humans. Nature 536, 285–291 (2016). doi: 10.1038/nature19057; pmid: 27535533 - DOI - PMC - PubMed
    1. Bender E, Gene therapy: Industrial strength. Nature 537, S57–S59 (2016). doi: 10.1038/537S57a; pmid: 27602741 - DOI - PubMed
    1. Kotterman MA, Schaffer DV, Engineering adeno-associated viruses for clinical gene therapy. Nat. Rev. Genet. 15, 445–451 (2014). doi: 10.1038/nrg3742; pmid: 24840552 - DOI - PMC - PubMed

Publication types

MeSH terms

Substances