. 2018 Dec 14;362(6420):eaat7615.
doi: 10.1126/science.aat7615.

Integrative functional genomic analysis of human brain development and neuropsychiatric risks

Collaborators

Integrative functional genomic analysis of human brain development and neuropsychiatric risks

Mingfeng Li et al. Science. .

Abstract

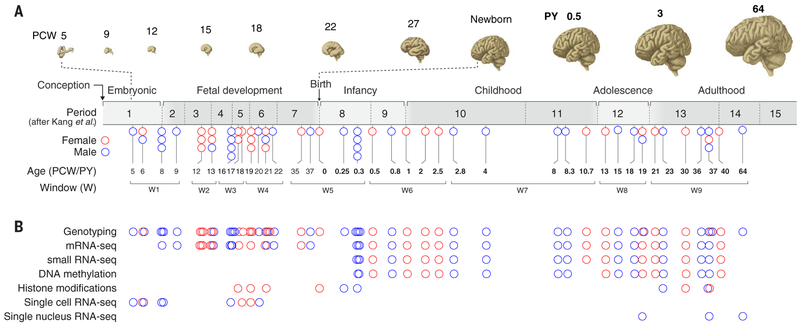
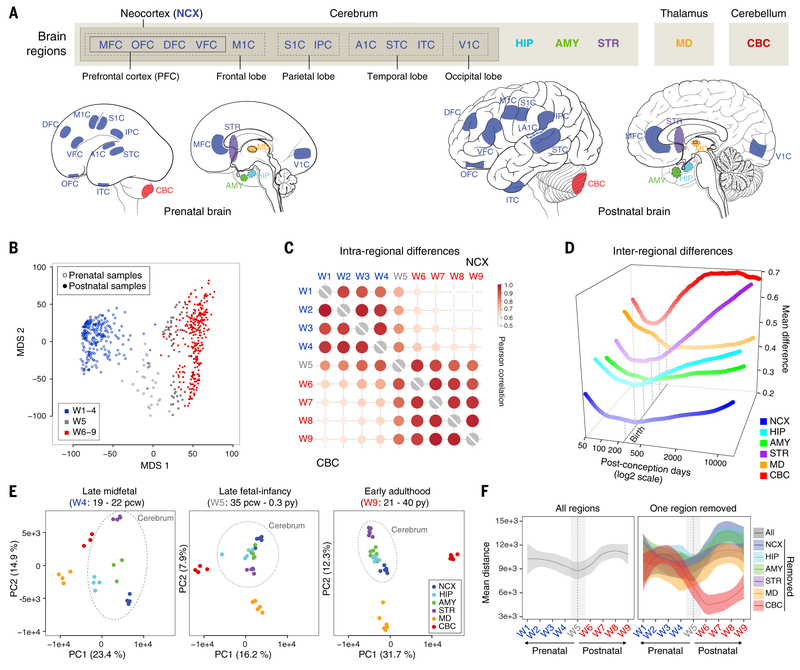
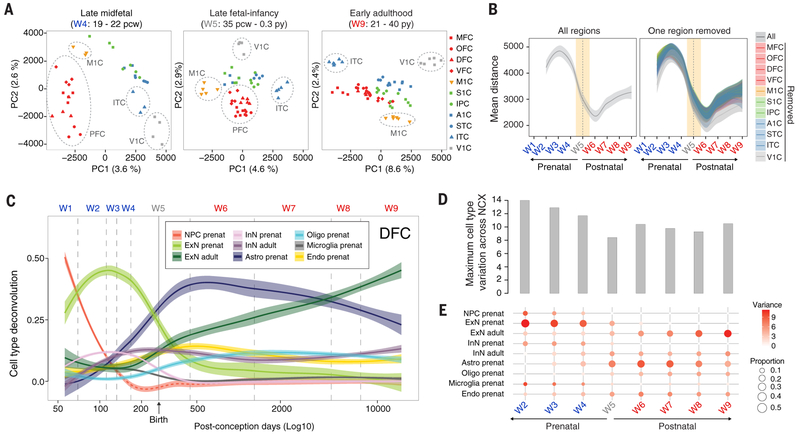
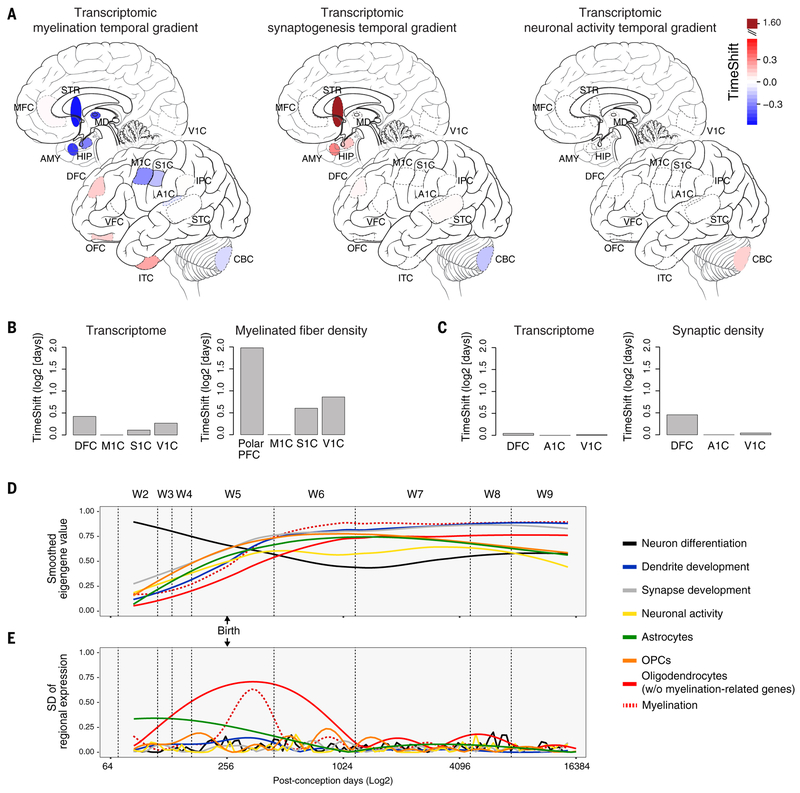
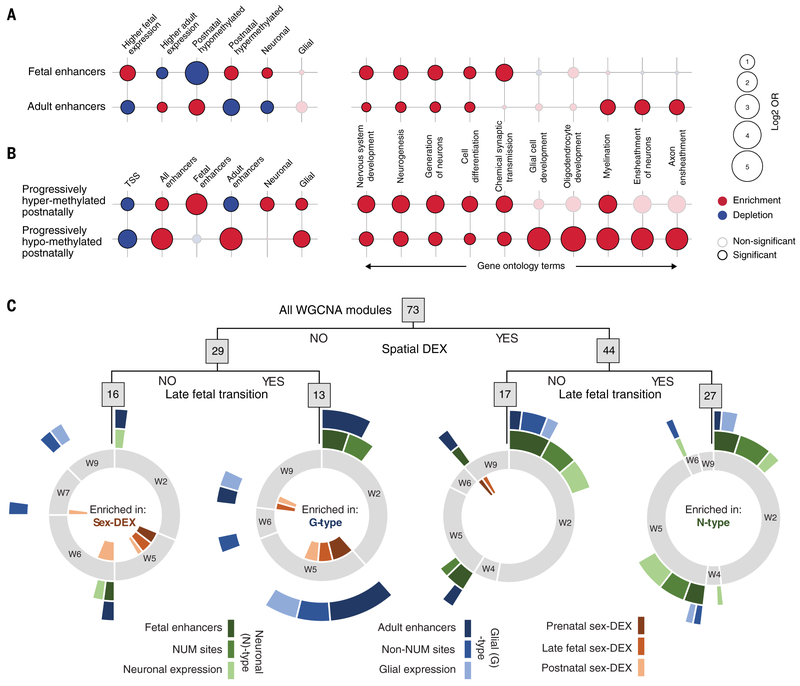
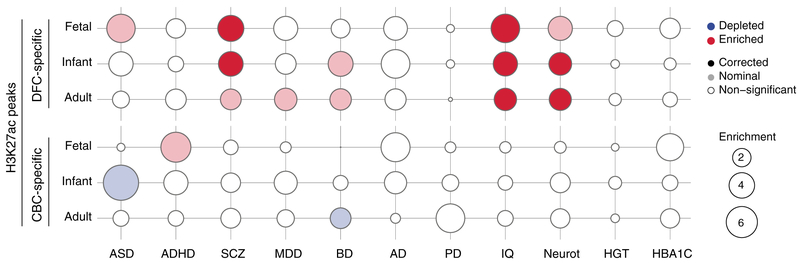
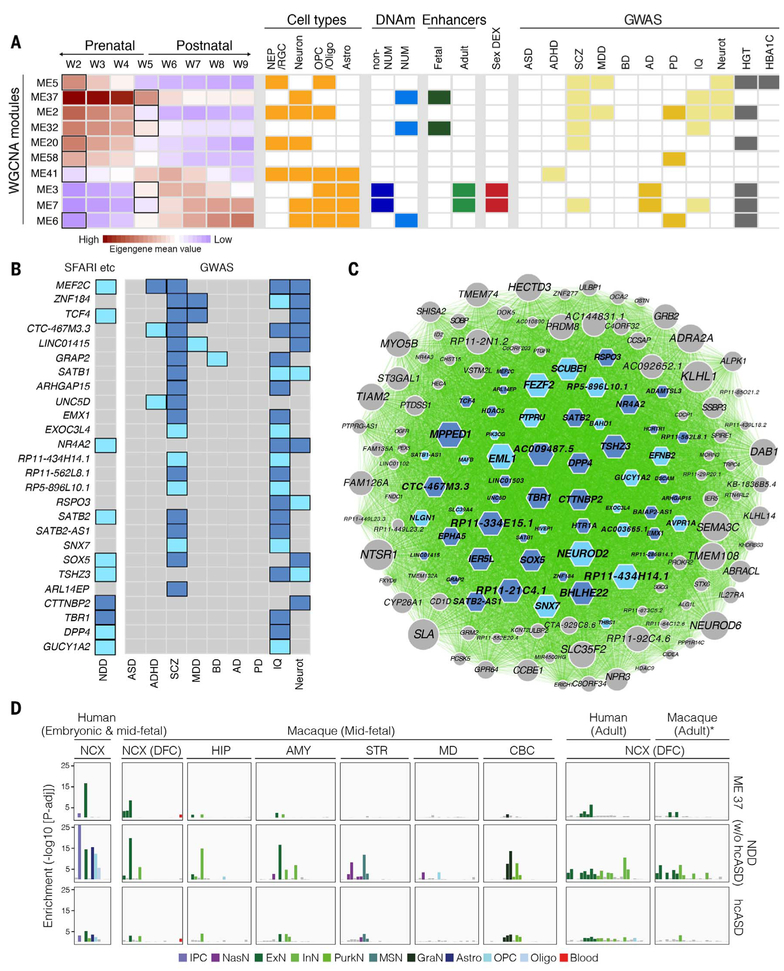
To broaden our understanding of human neurodevelopment, we profiled transcriptomic and epigenomic landscapes across brain regions and/or cell types for the entire span of prenatal and postnatal development. Integrative analysis revealed temporal, regional, sex, and cell type-specific dynamics. We observed a global transcriptomic cup-shaped pattern, characterized by a late fetal transition associated with sharply decreased regional differences and changes in cellular composition and maturation, followed by a reversal in childhood-adolescence, and accompanied by epigenomic reorganizations. Analysis of gene coexpression modules revealed relationships with epigenomic regulation and neurodevelopmental processes. Genes with genetic associations to brain-based traits and neuropsychiatric disorders (including MEF2C, SATB2, SOX5, TCF4, and TSHZ3) converged in a small number of modules and distinct cell types, revealing insights into neurodevelopment and the genomic basis of neuropsychiatric risks.


Conflict of interest statement

Competing interests: The authors declare no competing interests.

Figures

Fig. 1.
Fig. 1.. Overview of the data generated in this study.
(A) The developmental time span of the human brain, from embryonic ages (≤8 PCW) through fetal development, infancy, childhood, adolescence, and adulthood, with PCW and PY indicated. Below is the distribution of samples in this study across broad developmental phases (embryonic to adulthood), age [5 PCW to 64 PY (19)], and developmental windows (W1 to W9). Each circle represents a brain, and color indicates the sex [red circles (female) and blue circles (male)]. (B) Postmortem human brains sampled for different data modalities in this study are indicated.
Fig. 2.
Fig. 2.. Global transcriptomic architecture of the developing human brain.
(A) mRNA-seq dataset includes 11 neocortical areas (NCX) and five additional regions of the brain. IPC, posterior inferior parietal cortex; A1C, primary auditory (A1) cortex; STC, superior temporal cortex; ITC, inferior temporal cortex; V1C, primary visual (V1) cortex. (B) The first two multidimensional scaling components from gene expression showed samples from late fetal ages and early infancy (W5, gray) clustered between samples from exclusively prenatal windows (W1 to W4, blue) and exclusively postnatal windows (W6 to W9, red). (C) Intraregional Pearson’s correlation analysis found that samples within exclusively prenatal (W1 to W4) or postnatal (W6 to W9) windows correlated within, but not across, those ages. (D) Interregional transcriptomic differences revealed a developmental cup-shaped pattern in brain development. The interregional difference was measured as the upper quartile of the average absolute difference in gene expression of each area compared to all other areas. (E) AC-PCA for samples from all brain regions at late mid-fetal ages (W4), late fetal ages and early infancy (W5), and early adulthood (W9) showed that interregional differences were generally greater during W4 and W9 but reduced across W5. (F) Pairwise distance across samples using the first two principal components for all regions (left) or excluding one region at a time (right) demonstrated that the reduction of variation we observed is common across multiple brain regions, once the most differentiated transcriptomic profile (the cerebellum) is excluded. The shaded bands are 95% confidence intervals of the fitted lines.
Fig. 3.
Fig. 3.. Dynamics of cellular heterogeneity in the human neocortex.
(A) AC-PCA conducted on 11 neocortical areas showed decreased interareal variation across W5, similar to our observations of interregional variation in major brain regions. (B) Pairwise distance across samples using the first two principal components identified a late fetal transition in all of the neocortical areas we assessed, similar to what we observed across other brain regions. (C) Deconvolution of tissue-level data using cell type–enriched markers identified through single-cell sequencing of primary cells from 5 to 20 PCW postmortem human brains as well as from single-nuclei sequencing of adult human brains (27). (D) Maximum interareal variance across cell types for each window. (E) Neocortical areal variation in the transcriptomic signatures of each major cell type assayed in each developmental window. Because of dissection protocols and rapid brain growth across early fetal development, progenitor cell proportions are nonreliable estimates after W2 [red dashed line in (C)]. The shaded bands are 95% (B) and 50% (C) confidence intervals of the fitted lines. NPC, neural progenitor cells; ExN, excitatory neurons; InN, interneurons; Astro, astroglial lineage; Oligo, oligodendrocytes; Endo, endothelial cells.
Fig. 4.
Fig. 4.. Timing and temporal variation of gene expression associated with key neurodevelopmental processes.
(A) Temporal variation, as determined by the TempShift algorithm (34), in the expression of genes associated with myelination showed a broad gradient across the NCX and other brain regions, whereas synaptogenesis showed only a shift between brain regions (but not neocortical areas) and neuronal activity indicated the distinct nature of the cerebellum. (B and C) Application of the TempShift algorithm to previously published posttranslational analyses of myelinated fiber density (35) (B) and synaptic density (36) (C) in multiple neocortical areas yielded relationships between areas similar to those observed in the transcriptome. (D) Expression of genes associated with assorted biological processes highlights pronounced change during the late fetal period and W5. (E) Variation in myelination-associated genes peaks during W5, as evidenced by the standard deviation of the fitted regional mean, driving interregional variation during this and neighboring (W4 and W6) windows.
Fig. 5.
Fig. 5.. Integration of gene expression and epigenetic regulation with cell types and biological processes.
(A) Fetal-active enhancers (top left) were generally enriched for sites where methylation progressively increased across postnatal ages and associated with genes whose expression was higher during fetal development than adulthood and whose expression was enriched in neurons as compared to glia. Conversely, adult-active enhancers were enriched for sites exhibiting progressively lower methylation across postnatal ages and depleted for associations with higher fetal gene expression and expression in neurons. These enhancers were also enriched for gene ontology terms generally involving neurons and glia, respectively. OR, odds ratio. (B) Sites where methylation progressively increased across postnatal ages and where methylation progressively decreased across postnatal ages were generally enriched for fetal enhancers and genes whose expression was enriched in neurons, or adult enhancers and genes whose expression was enriched in glia, respectively, as well as related gene ontology terms. (C) Modules identified through WGCNA were segregated by regulation across brain regions, prenatal and postnatal gene expression in the NCX, both, or neither. Spatiotemporal modules (right) were enriched for modules that are themselves enriched for genes associated with enhancers active in the fetal DFC, associated with sites undermethylated in NeuN-positive (neuronal) cells, and/or enriched in neurons (N-type associations). Temporal, nonspatial modules (second from left) were enriched for modules that are themselves enriched for genes associated with enhancers active in the adult DFC, associated with sites undermethylated in non-NeuN-positive (non-neuronal) cells, and/or genes enriched in glia (G-type associations). Modules exhibiting no spatial or temporal specificity (left) were enriched for genes exhibiting sex-biased gene expression across neocortical development. Full circles (gray) indicate the proportion of modules in each category of modules exhibiting their greatest rate of change in W1 through W9.
Fig. 6.
Fig. 6.. Enrichment analysis for GWAS loci among putative regulatory elements.
Putative promoters and enhancers (H3K27ac peaks) specific for DFC or CBC in the fetal, infant, or adult were enriched for SNP heritability identified through partitioned LD score regression analysis from GWASs for autism spectrum disorder [ASD, (40)], attention-deficit hyperactive disorder [ADHD, (41)], schizophrenia [SCZ, (37)], major depressive disorder [MDD, (42)], bipolar disorder [BD, (43)], Alzheimer’s disease [AD, (38)], Parkinson’s disease [PD, (39)], IQ, (44), or neuroticism [Neurot, (45)] but not for non-neural disorders or traits such as height [HGT, (46)] or diabetes [HBA1C, (49)]. Solid color indicates significance for Bonferroni adjusted P value, and faint color indicates nominal significance at LD score regression P < 0.05.
Fig. 7.
Fig. 7.. Convergence of risk for brain-based traits and disorders on discrete coexpression modules and cell types.
(A) Genes associated with disease risk (right; light yellow indicates neuropsychiatric disorder or brain-based trait, and dark yellow indicates adult-onset disorder) were identified by integrating GWAS, Hi-C, and H3K27ac data and converged on 10 WGCNA modules. Many of these modules exhibited dynamic expression across time; the bold rectangles in the left panel indicate the windows with greatest rate of change. Many were also enriched for gene expression associated with distinct cell types (orange), putative active enhancers (green), and/or sites undermethylated in NeuN-positive (NUM) or NeuN-negative cells (blue, non-NUM). (B) Schematic highlighting genes in ME37 that were implicated by our study in multiple neuropsychiatric disorders (ADHD, SCZ, MDD, or BD) and neurological traits (IQ or Neurot) (list 1, light blue; list 2, dark blue), as well as neurodevelopmental disorder (NDD) risk genes, including two independent lists of high-confidence risk genes associated with ASD through de novo mutations or copy number variants [dark blue, (66)] as well as ASD risk genes identified from the SFARI dataset (light blue, http://gene.sfari.org) or for developmental delay (67). Genes implicated in only a single disorder or trait are not shown in this panel. (C) Network representation of ME37 showing connectivity between genes based on Pearson correlation. Genes linked to NDDs or neurological characteristics in our study are indicated using either dark blue–shaded or light blue–shaded hexagons, as in (B). The size of a given hexagon (or circle, indicating no association in this study) is proportional to the degree of each gene under a minimum correlation value of 0.7. (D) Enrichment for genes in ME37 or two lists of ASD risk genes among the fetal and adult cell types we identified from human NCX and multiple regions of the macaque (34) brain. For graphical representation, log10 P values are capped at 25. *Adult macaque cells were classified into human adult clusters using Random Forest. NEP/RGC, neural epithelial progenitor/radial glial lineage; MSN, medium spiny neurons; NasN, nascent neurons; GraN, granule neurons; PurkN, Purkinje neurons; IPC, intermediate progenitor cells; OPC, oligodendrocyte progenitor cells.

References

    1. Lein ES, Belgard TG, Hawrylycz M, Molnár Z, Transcriptomic perspectives on neocortical structure, development, evolution, and disease. Annu. Rev. Neurosci 40, 629–652 (2017). doi: 10.1146/annurev-neuro-070815-013858; - DOI - PubMed
    1. Silbereis JC, Pochareddy S, Zhu Y, Li M, Sestan N, The cellular and molecular landscapes of the developing human central nervous system. Neuron 89, 248–268 (2016). doi: 10.1016/j.neuron.2015.12.008; - DOI - PMC - PubMed
    1. Geschwind DH, Rakic P, Cortical evolution: Judge the brain by its cover. Neuron 80, 633–647 (2013). doi: 10.1016/j.neuron.2013.10.045; - DOI - PMC - PubMed
    1. Lui JH, Hansen DV, Kriegstein AR, Development and evolution of the human neocortex. Cell 146, 18–36 (2011). doi: 10.1016/j.cell.2011.06.030; - DOI - PMC - PubMed
    1. Paus T, Keshavan M, Giedd JN, Why do many psychiatric disorders emerge during adolescence? Nat. Rev. Neurosci 9, 947–957 (2008). doi: 10.1038/nrn2513; - DOI - PMC - PubMed

Publication types

Grants and funding