. 2018 Dec 14;362(6420):eaat8077.
doi: 10.1126/science.aat8077. Epub 2018 Dec 13.

Spatiotemporal transcriptomic divergence across human and macaque brain development

Affiliations

Spatiotemporal transcriptomic divergence across human and macaque brain development

Ying Zhu et al. Science. .

Abstract

Human nervous system development is an intricate and protracted process that requires precise spatiotemporal transcriptional regulation. We generated tissue-level and single-cell transcriptomic data from up to 16 brain regions covering prenatal and postnatal rhesus macaque development. Integrative analysis with complementary human data revealed that global intraspecies (ontogenetic) and interspecies (phylogenetic) regional transcriptomic differences exhibit concerted cup-shaped patterns, with a late fetal-to-infancy (perinatal) convergence. Prenatal neocortical transcriptomic patterns revealed transient topographic gradients, whereas postnatal patterns largely reflected functional hierarchy. Genes exhibiting heterotopic and heterochronic divergence included those transiently enriched in the prenatal prefrontal cortex or linked to autism spectrum disorder and schizophrenia. Our findings shed light on transcriptomic programs underlying the evolution of human brain development and the pathogenesis of neuropsychiatric disorders.


Conflict of interest statement

Competing interests: Authors have no conflict of interest.

Figures

Fig. 1.
Fig. 1.. Conserved and divergent transcriptomic features of human and macaque neurodevelopmental processes.
(A) Plot depicting the real age (x axis) and the age predicted by TranscriptomeAge (y axis) of human (red), chimpanzee (blue), and macaque (green). Macaque (164 PCD) and human (266 PCD) births are labeled with green or red dashed line, respectively. (B) Schematic showing the human developmental periods, as described in Kang et al., 2011 (29) and the matched macaque developmental and chimpanzee adult data sets. Each line corresponds to one macaque or one chimpanzee specimen and the corresponding predicted age when compared to human neurodevelopment. PCD – post-conception day; PY – postnatal year. (C) The weight (W) of five transcriptomic signatures in the developing human and macaque NCX and the respective association with neurodevelopmental processes. In signature 1 (neurogenesis), the arrow indicates the point at which the signature reaches the minimum in human (red) and macaque (green). The asterisk indicates the extension of the early fetal period that is also observed in (B), in which early fetal macaques (E60) cluster with mid-fetal humans. In transcription signatures 2, 3, 4, and 5, arrows indicate the point at which the signatures reach the maximum in human (red) or macaque (green). Note that for transcriptomic signatures 2 and 3 (neuronal differentiation and astrogliogenesis) there is a synchrony between human and macaque, whereas for transcriptomic signature 4 and 5 (synaptogenesis and myelination), there is heterochrony between the species, with acceleration in human synaptogenesis and delay in human myelination. Prefrontal cortical areas are plotted in red, primary motor cortex in orange, parietal areas in green, temporal areas in blue, and primary visual cortex in gray. MFC – medial prefrontal cortex; OFC – orbital prefrontal cortex; DFC – dorsolateral prefrontal cortex; VFC – ventrolateral prefrontal cortex; M1C – primary motor cortex; S1C – primary somatosensory cortex; IPC – inferior posterior parietal cortex; A1C – primary auditory cortex; STC – superior temporal cortex; ITC – inferior temporal cortex; V1C – primary visual cortex. (D) Cell type-enrichment is shown for each signature. P values adjusted by Benjamini–Hochberg procedure were plotted (size of dots) and significance was labeled by color (True: red and False: gray). H – human; M – macaque; eNPC – embryonic neuroepithelial progenitor; eIPC – embryonic intermediate progenitor cell; eNasN – embryonic nascent neuron; ExN – excitatory neuron; InN – interneuron; Astro – astrocyte; OPC – oligodendrocyte progenitor cell; Oligo – oligodendrocyte; Endo – endothelial cell; VSMC – vascular smooth muscle cell.
Fig. 2.
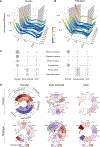
Fig. 2.. Ontogenetic inter-regional transcriptomic differences display a cup-shaped pattern in human and macaque.
(A-B) The inter-regional difference of a given module was measured as the average distance of each neocortical area to all other areas in the (A) human and (B) macaque neocortices across development. The upper quartile inter-regional difference among all genes was plotted and the magnitude was shown in colors. The gray planes represent the transition from prenatal to early postnatal development (late fetal transition) and from adolescence to adult. (C) The number of co-expression modules that display gradient-like expression (anterior-posterior, posterior-anterior, medial-lateral, temporal lobe-enriched), and enrichment in primary areas or enrichment in association areas in each developmental phase. Left panel corresponds to human modules, right panel to macaque modules. (D) Donut plots depicting the modules (from (C)) that exhibited species-distinct inter-regional differences. Red indicates high expression of the genes in the module; blue indicates low expression of the genes in the module. Prenatal modules show a human-distinct anterior-posterior expression gradient (left panel); macaque-distinct early postnatal modules show enrichment in primary or association areas (middle panel); and a macaque-distinct adult module is enriched in association areas, especially in MFC (right panel). The expression pattern of each species-distinct module is shown in human (top) and macaque (bottom). HS – Human (Homo sapiens) module; MM – macaque (Macaca mulatta) module.
Fig. 3.
Fig. 3.. Transcriptomic divergence between human and macaque throughout neurodevelopment reveals a phylogenetic cup-shaped pattern.
(A) The inter-species divergence, measured as the absolute difference in gene expression, between human and macaque in each brain region throughout development (coded as in Fig 2A). The upper quartile divergence among all genes was plotted. The gray planes represent the transition from prenatal to early postnatal development (late fetal transition, left) and from adolescence to adult (right). (B) Venn diagram displaying the number of differentially expressed genes (DEX, top) or genes with differential exon usage (DEU, bottom) between human and macaque in at least one brain region during prenatal development, early postnatal development, and adulthood. (C) Bubble matrix with examples of genes showing global or regional inter-species differential expression. Brain regions displaying significant differential expression between human and macaque are shown with black circumference. Red circles show up-regulation in human; blue shows up-regulation in macaque. Circle size indicates absolute log2 fold change. (D) Percentage of overlap between genes showing the highest inter-species divergence in each region (driving the evolutionary cup-shaped pattern), and genes with the largest pairwise distance between brain regions in prenatal (red), early postnatal (green) and adult (green) human (solid lines) and macaque brains (dashed lines; driving the developmental cup-shaped pattern). The result was plotted using a variable number of the highest ranked genes based on inter-regional difference and the inter-species divergence. Mean and standard deviation (error bar) across regions were plotted.
Fig. 4.
Fig. 4.. Cell-type specificity of species differences.
(A) Cell type enrichment for genes up- or down-regulated in human neocortical areas. Enrichment of genes up-regulated in human or macaque was tested using single cells from prenatal human neocortex (33) or macaque DFC, respectively. The plot shows -log10-P values adjusted by Benjamini–Hochberg procedure averaged across all neocortical areas (NCX), prefrontal areas (PFC) and non-prefrontal areas (nonPFC). Significance was labeled by color (True: red and False: gray). (B) Cell type enrichment for genes up- or down-regulated in human neocortical areas. Enrichment of genes up-regulated in human or macaque was tested using single nuclei from adult human neocortex (33) or macaque DFC, respectively. P values were adjusted by Benjamini–Hochberg procedure and the log-transformed P values averaged across all neocortical areas (NCX), prefrontal areas (PFC) and non-prefrontal areas (nonPFC) was plotted (size). Significance was labeled by color (True: red and False: gray). (C) Cell type-enrichment of selected genes showing human-distinct up- or down-regulation in adult brain regions or neocortical areas (34). Preferential Expression Measure (PEM) (size and color) was plotted to show the cell type specificity.eNPC – embryonic neuroepithelial progenitor; eIPC – embryonic intermediate progenitor cell; eNasN – embryonic nascent neuron; ExN – excitatory neuron; InN – interneuron; Astro – astrocyte; OPC – oligodendrocyte progenitor cell; Oligo – oligodendrocyte; Endo – endothelial cell; VSMC – vascular smooth muscle cell.
Fig. 5.
Fig. 5.. Shared and divergent transcriptomic features of homologous cell types between human and macaque.
(A) Dendrogram and heatmap showing diversity and correlation of prenatal cell types within and between the two species. The human single cells were from (33). (B) Dendrogram and heatmap showing diversity and correlation of adult cell types within and between the two species. (C) Cell type specificity of inter- species differentially expressed genes based on the single-cell/nucleus information. Blue, human down-regulated genes; and red, human up-regulated genes.
Fig. 6.
Fig. 6.. Heterochronic expression of regional and inter-species gene clusters.
(A) Clusters of genes exhibiting species-distinct regional heterochronic expression patterns in human and macaque brains at various prenatal periods and adulthood. The timing of expression of genes in the cluster is represented by blue (earlier expression) to red (later expression). Prenatal heterochronic regional clusters RC21 and RC34 show earlier expression (blue) in human prenatal fronto-parietal perisylvian neocortical areas (M1C, S1C, and IPC) and enrichment in neural progenitors. RC10 is composed of genes with earlier expression in the human prenatal prefrontal cortex and enrichment in astrocytes. These observed regional expression patterns are not present in the macaque prenatal NCX. Adult heterochronic cluster RC25 shows earlier expression in primary areas of the macaque cortex and enrichment for genes associated with oligodendrocytes. (B) A network of 139 inter-species heterochronic genes (blue) is enriched for targets of putative upstream transcriptional regulators that include those encoded by eight genes of the same network (red), and TWIST1 (green), a transcription factor with inter-species heterotopic expression (fig. S34). Arrows indicate direction of regulation. (C) Top five canonical pathways enriched among inter-species heterochronic genes in at least one neocortical area. (D) Cluster EC14 shows inter-species heterochronic expression, exhibits a delayed expression specifically in the human prenatal prefrontal cortex, and is enriched for genes selectively expressed by intermediate progenitor cells (IPC).
Fig. 7.
Fig. 7.. Heterotopic and/or heterochronic expression of disease-associated genes between human and macaque.
(A) Bar plot depicting the number of genes associated with autism spectrum disorder (ASD; high confidence [hc]), neurodevelopmental disorders (NDD), attention deficit hyperactivity disorder (ADHD), schizophrenia (SCZ), bipolar disorder (BD), major depressive disorder (MDD), Alzheimer’s disease (AD), and Parkinson’s disease (PD) that display heterochronic divergence between human and macaque. (B) Bubble matrix showing the heterochronic expression of ASD and SCZ- associated genes. Blue represents earlier expression in human; red represents earlier expression in macaque. (C) Bar plot depicting the number of genes associated with neuropsychiatric disorders that exhibit heterotopic divergence between human and macaque. The 14 SCZ-associated genes that displayed heterotopy were grouped into 5 clusters on the basis of their spatio-temporal expression profiles (fig. S41). (D) Donut plots exhibiting the centered expression of the 5 SCZ-associated heterotopic clusters in prenatal, early postnatal development, and adulthood. Cluster numbers are labeled with the same color as in panel C. Clusters that are not significantly divergent between species in each period are grey and do not have a black border. Red indicates high expression; blue indicates low expression.

References

    1. Montagu MFA, Time, Morphology, and Neoteny in the Evolution of Man. Am. Anthropol. 57, 13–27 (1955).
    1. Dobbing J, Sands J, Quantitative growth and development of human brain. Arch. Dis. Child 48, 757–767 (1973). - PMC - PubMed
    1. Prechtl HF, New perspectives in early human development. European journal of obstetrics, gynecology, and reproductive biology 21, 347–355 (1986). - PubMed
    1. Bogin B, Evolutionary perspective on human growth. Annu. Rev. Anthropol. 28, 109–153 (1999). - PubMed
    1. Schultz AH, Age changes in primates and their modification in man. J. M. Tanner, Ed., Growth Human (Pergamon Press, Oxford, 2009).

Publication types