. 2018 Dec 14;362(6420):eaat8464.
doi: 10.1126/science.aat8464.

Comprehensive functional genomic resource and integrative model for the human brain

Collaborators

Comprehensive functional genomic resource and integrative model for the human brain

Daifeng Wang et al. Science. .

Abstract

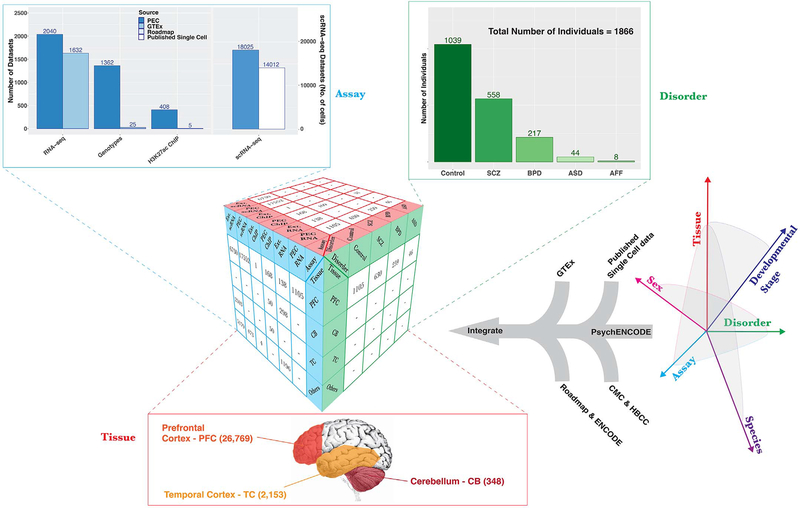
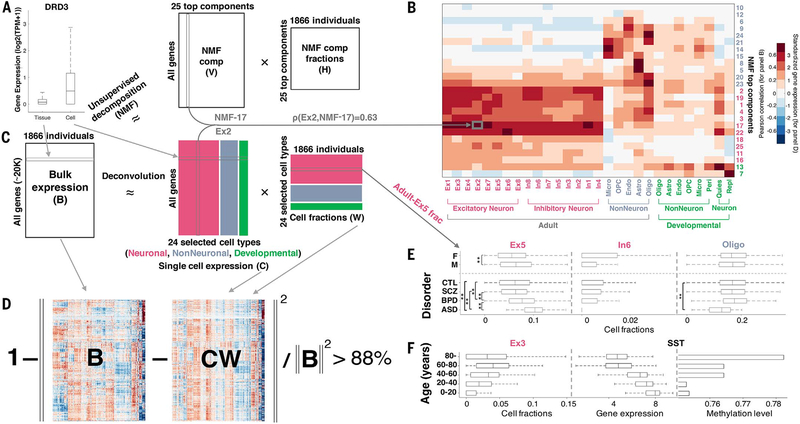
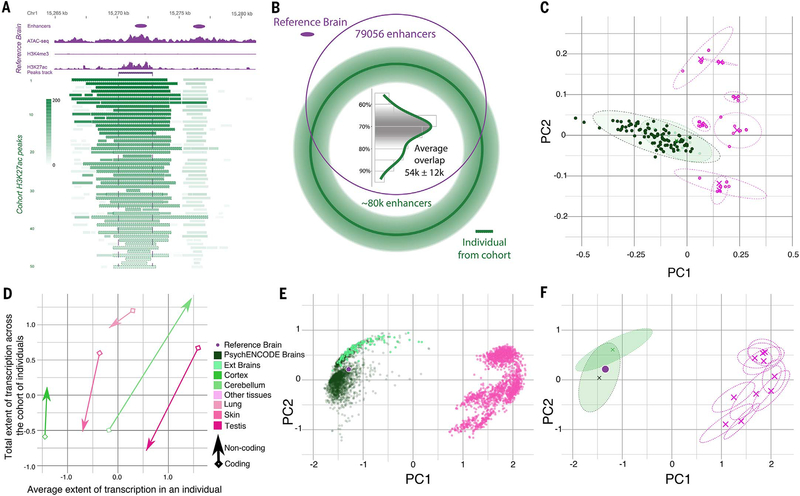
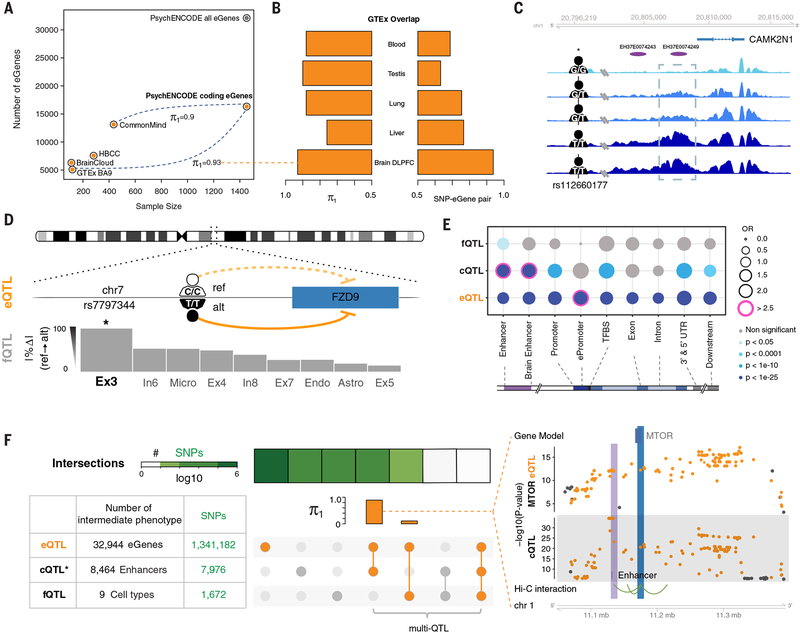
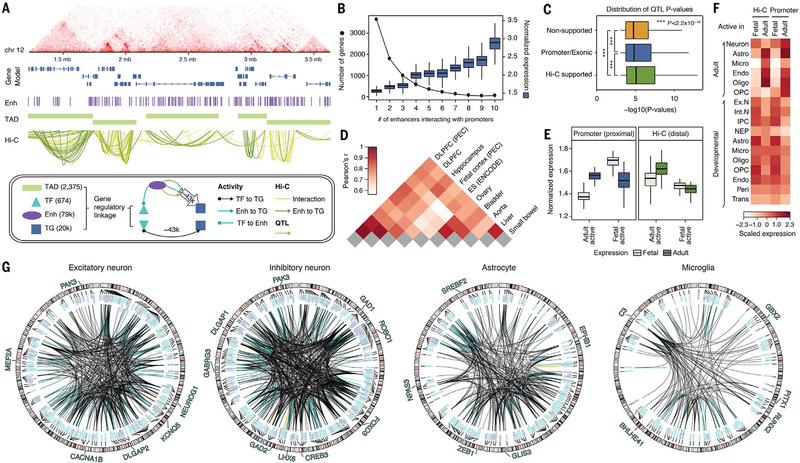
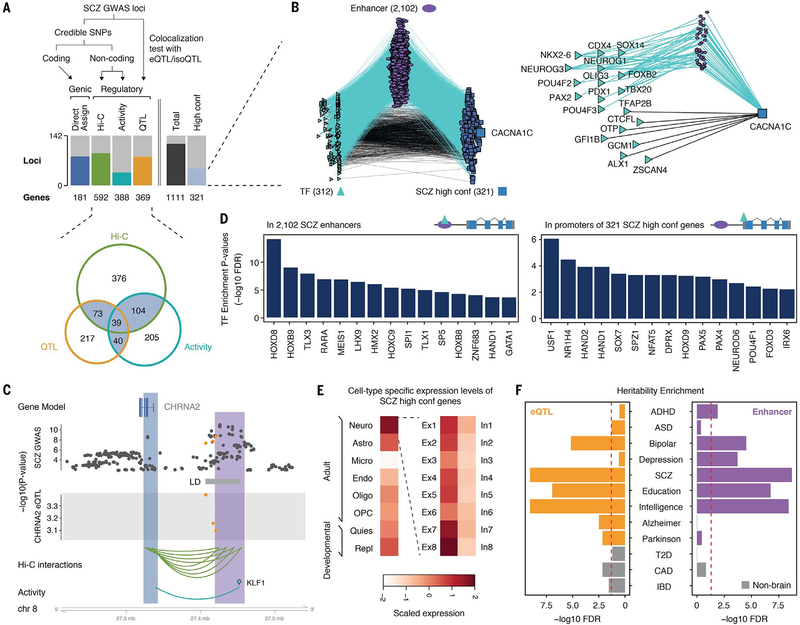
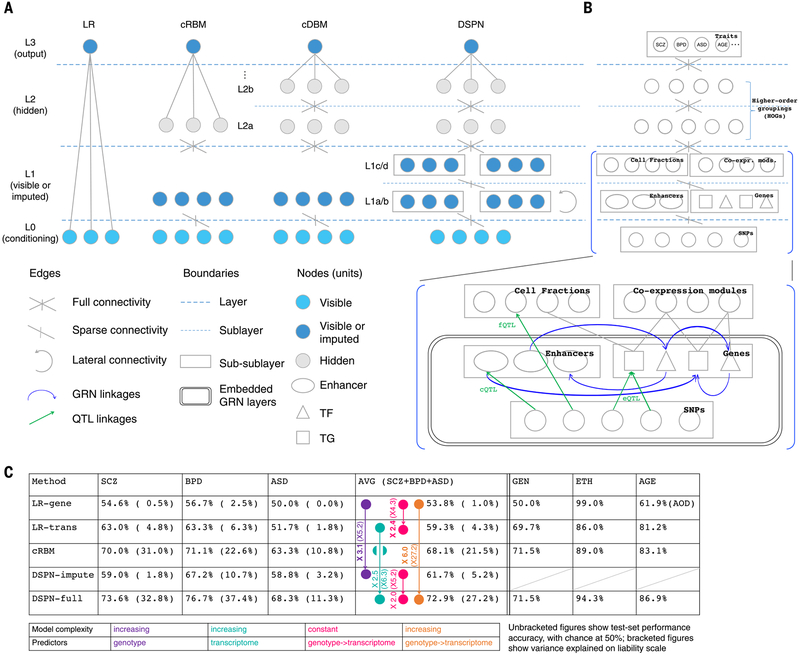
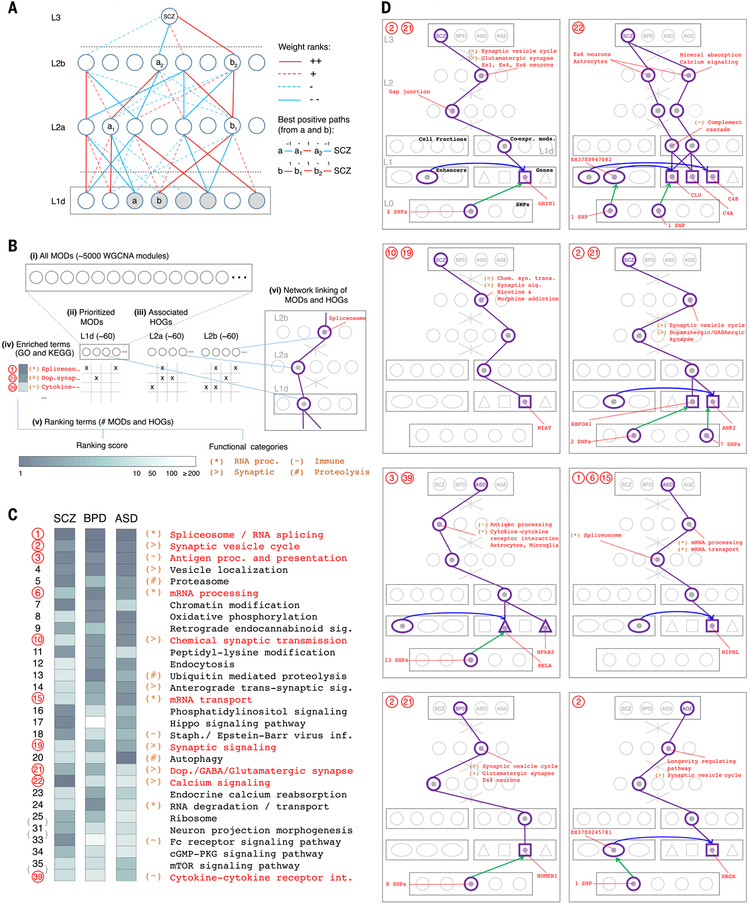
Despite progress in defining genetic risk for psychiatric disorders, their molecular mechanisms remain elusive. Addressing this, the PsychENCODE Consortium has generated a comprehensive online resource for the adult brain across 1866 individuals. The PsychENCODE resource contains ~79,000 brain-active enhancers, sets of Hi-C linkages, and topologically associating domains; single-cell expression profiles for many cell types; expression quantitative-trait loci (QTLs); and further QTLs associated with chromatin, splicing, and cell-type proportions. Integration shows that varying cell-type proportions largely account for the cross-population variation in expression (with >88% reconstruction accuracy). It also allows building of a gene regulatory network, linking genome-wide association study variants to genes (e.g., 321 for schizophrenia). We embed this network into an interpretable deep-learning model, which improves disease prediction by ~6-fold versus polygenic risk scores and identifies key genes and pathways in psychiatric disorders.


Conflict of interest statement

Competing interests: G.E.C. is a co-founder of Element Genomics. K.P.W. is associated with Tempus Labs. The other authors declare no competing interests.

Figures

Fig. 1.
Fig. 1.. Comprehensive data resource for functional genomics of the human brain.
The functional genomics data generated by the PsychENCODE Consortium (PEC) constitute a multidimensional exploration across tissue, developmental stage, disorder, species, assay, and sex. The central data cube represents the results of our data integration for the three dimensions of disorder, assay, and tissue, where the numbers of datasets in the analysis are depicted. Projections of the data onto each of these three parameters are shown as graphs for assay and disorder and as a schematic for the primary brain regions of interest. Assay: Dataset numbers for a subset of assays are shown, including RNA-seq (2040 PsychENCODE samples and 1632 GTEx samples, used in multiple downstream analyses), genotypes (1362 PsychENCODE and 25 GTEx individuals for a total of 1387 individuals matched to RNA-seq samples for QTL analysis after quality control filtering), and H3K27ac ChIP-seq (408 PsychENCODE and 5 Roadmap samples). The number of cells assayed by small conditional RNA sequencing (scRNA-seq) (right-hand y axis) is 18,025 for PsychENCODE and 14,012 for external (ext.) datasets. Disorder: Across all assays, there are 113 GTEx and 926 PsychENCODE control individuals and 558 SCZ, 217 BPD, 44 ASD, and 8 affective disorder (AFF) individuals from PsychENCODE, resulting in 1866 individuals. Tissue: Three brain regions are considered—the PFC (n = 26,769 samples), TC (n = 2153 samples), and CB (n = 348 samples). See table S11 and (19) for more details. HBCC, Human Brain Collection Core.
Fig. 2.
Fig. 2.. Deconvolution analysis of bulk and single-cell transcriptomics reveals cell fraction changes across the population.
(A) Genes had significantly higher expression variability across single cells sampled from different types of brain cells than across equivalent tissue samples taken from a population of individuals. (Left) Dopamine gene DRD3. (B) The heatmap shows the Pearson correlation coefficients of gene expression between the NMF-TCs and single-cell signatures (for n = 457 biomarker genes) (15). Micro, microglia; OPC, oligodendrocyte progenitor cells; endo, endothelial cells; astro, astrocytes; oligo, oligodendrocytes; peri, pericytes; quies, quiescent cells; repl, replicating cells. (C) (Top) The bulk tissue gene expression matrix (B, genes by individuals) can be decomposed by NMF (see fig. S52). (Bottom) The bulk tissue gene expression matrix B can be also deconvolved by the single-cell gene expression matrix (C, genes by cell types) to estimate the cell fractions across individuals (the matrix W); i.e., BCW. The three major cell types analyzed are depicted with neuronal cells in red, nonneuronal cells in blue, and developmental cells in green, as highlighted by column groups in matrix C (also row groups in W). frac, fraction. (D) The estimated cell fractions can account for >88% of the bulk tissue expression variation across the population. (E) Cell fraction changes across genders and brain disorders. **Differences from control samples are significant (via a Kolmogorov-Smirnov test) after accounting for age distributions. See table S12 for more detail. CTL, control. (F) Changing cell fractions (for Ex3), gene expression (for SST), and promoter methylation level (median level, for SST) across age groups are shown. With increasing age, the fractions of Ex3 and Ex4 significantly increase, and some nonneuronal types decrease (Ex3 trend analysis, P < 6.3 × 10⁻¹⁰).
Fig. 3.
Fig. 3.. Comparative analysis of transcriptomics and epigenomics between the brain and other tissues.
(A) Epigenetics signals of the reference brain (purple) were used to identify active enhancers with the ENCODE enhancer pipeline. The H3K27ac signal tracks at the corresponding enhancer region from each individual in the cohort are shown in green, with the gradient showing the normalized signal value for each H3K27ac peak. (B) The overlap of the H3K27ac peaks from an individual in the population with the reference brain enhancers is shown as a Venn diagram. The histogram shows the varying percentages of overlapped H3K27ac peaks across individuals. (C) The tissue clusters of RCA coefficients [principal component 1 (PC1) versus PC2] for chromatin data of any potential regulatory elements are shown. Clusters of PsychENCODE samples (dark green ellipses), external brain samples (light green ellipses), and other non-brain tissues (magenta ellipses) are plotted. (D) The extent of transcription for coding (arrowhead) and noncoding (diamond) regions. The average transcription extent (x axis) is shown compared with the cumulative extent of transcription across a cohort of individuals (y axis) for select tissue types, including the CB, cortex, lung, skin, and testis, by using polyadenylate RNA-seq data. (E and F) Similar to (C), but now for transcription rather than epigenetics. (E) RCA coefficients for gene expression data from PsychENCODE, GTEx brains, and other tissue samples are shown in dark green, light green, and magenta, respectively. (F) The center (cross) and ranges of different tissue clusters (dashed ellipses) are shown on an RCA scatterplot of (E).
Fig. 4.
Fig. 4.. QTLs in the adult brain.
(A) The frequency of genes with at least one eQTL (eGenes) is shown across different studies. The number of eGenes increased as the sample size increased. PsychENCODE eGenes are close to saturation for protein-coding genes. The estimated replication π1 values for GTEx and CMC eQTLs versus PsychENCODE are shown (36). (B) The similarity between PsychENCODE brain dorsolateral PFC (DLPFC) eQTLs and GTEx eQTLs of other tissues are evaluated by π1 values and SNP-eGene overlap rates. Both π1 values and SNP-eGene overlap rates are higher for brain DLPFC than for the other tissues. (C) An example of an H3K27ac signal across individuals in a representative genomic region, showing largely congruent identification of regions of open chromatin. The region within the dashed rectangle represents a cQTL; the signal magnitudes for individuals with a G/G or G/Tgenotype were lower than those for individuals with a T/Tgenotype. chr1, chromosome 1; rs, reference SNP. (D) An example of the mechanism by which an fQTL may affect phenotype. This fQTL overlaps with an eQTL for FZD9, a gene located in the 7q11.23 region that is deleted in Williams syndrome. The fQTL may affect the fraction of Ex3 by regulating FZD9 expression. Only Ex3 constitutes a statistically significant fQTL with this SNP (as designated by the asterisk). ref, reference; alt, alternate. (E) The enrichment of QTLs in different genomic annotations is shown. Pink circles indicate highly significant enrichment (P < 1 × 10⁻²⁵ and OR > 2.5). OR, odds ratio; TFBS, TF binding site; UTR, untranslated region. (F) Numbers of identified QTL-associated elements (eGenes, enhancers, and cell types) and QTL SNPs are shown in the bottom left table. Asterisks indicate that, for cQTLs, we show only the number of top SNPs for each enhancer. Overlaps of all QTL SNPs are shown in heatmaps (square rows). The linked circles show the overlap of QTL types. The intersections of other QTLs with eQTLs are evaluated by using π1 values in the orange bar plot. The greatest intersection is between cQTLs and eQTLs. An example is displayed on the right: the intersection of eQTL SNPs (for the MTOR gene) and cQTL SNPs (for the H3K27ac signal on an enhancer ~50 kb upstream of the gene). Hi-C interactions (bottom) indicate that the enhancer interacts with the promoter of MTOR, suggesting that the cQTL SNPs potentially mediate the expression modulation manifest by the eQTL SNPs.
Fig. 5.
Fig. 5.. Building a gene regulatory network (GRN) from Hi-C and data integration.
(A) A full Hi-C dataset from adult brain reveals the higher-order structure of the genome, ranging from contact maps (top) to TADs and promoter-based interactions. (Bottom) A schematic of how we leveraged gene regulatory linkages involving TADs, TFs, enhancers (Enh), and target genes (TG) to build a full GRN (fig. S42) and a high-confidence subnetwork consisting of 43,181 TF–to–target gene promoter and 42,681 enhancer–to–target gene promoter linkages (21). (B) We compared the number of genes (left y axis, dotted line) and the normalized gene expression levels (right y axis, boxes) with the number of enhancers that interact with the gene promoters. Boxes show means and SDs. (C) QTLs that were supported by Hi-C evidence (174,719) showed more significant P values than those that were not (promoter or exonic QTLs, 130,155; nonsupported QTLs, 1,065,311). (D) Cross-tissue comparison of chromatin architecture indicates that adult brains in PsychENCODE and Roadmap (e.g., DLPFC and hippocampus tissues) share chromatin architecture more than nonrelated tissue types. Fetal brain shows chromatin architecture distinct from that in adult brain, indicating extensive rewiring of chromatin structures during brain development. ES, embryonic stem cell. (E) Genes assigned to fetal active elements are prenatally enriched, whereas genes assigned to adult active elements are postnatally enriched. (F) Genes assigned to fetal active elements are relatively more enriched in neurons in the adult brain and fetal (developmental) brain, whereas genes assigned to adult active elements are relatively more enriched in glia (adult astrocytes, endothelial cells, and oligodendrocytes). Ex. N, excitatory neuron; Int. N, inhibitory neuron; IPC, intermediate progenitor cells; NEP, neuroepithelial cells; trans, transient cell type. (G) The circos plots show the linkages from the full regulatory network targeting the cell-type–specific biomarker genes. The biomarker genes for excitatory or inhibitory neuronal type are the biomarker genes shared by at least five excitatory or inhibitory subtypes (20). Selected TFs for particular cell types are highlighted.
Fig. 6.
Fig. 6.. GRNs assign genes to GWAS loci for psychiatric disorders.
(A) A schematic depicting how SCZ GWAS loci were assigned to putative genes. The number of SCZ GWAS loci and their putative target genes (SCZ genes) annotated by each assignment strategy is indicated (top). The overlap between SCZ genes defined by QTL associations (QTL), chromatin interactions (Hi-C), and activity relationships (activity) is depicted in a Venn diagram (bottom). SCZ genes with more than two evidence sources were defined as high-confidence (high conf.) genes. (B) A GRN of TFs, enhancers, and 321 SCZ high-confidence genes, on the basis of TF activity linkages. A subnetwork for CACNA1C is highlighted on the right. (C) An example of the evidence indicating that GWAS SNPs that overlap with CHRNA2 eQTLs also have chromatin interactions and activity correlations with the same gene. Orange dots refer to SNPs that overlap between eQTLs and GWAS plots. (D) TFs that are significantly enriched in enhancers (left) and promoters (right) of SCZ genes. FDR, false discovery rate. (E) SCZ genes show higher expression levels in neurons (particularly excitatory neurons) than in other cell types. (F) Brain disorder GWAS show stronger heritability enrichment in brain regulatory variants (eQTLs) and elements (enhancers) than non–brain disorder GWAS. ADHD, attention-deficit/hyperactivity disorder; T2D, type 2 diabetes; CAD, coronary artery disease; IBD, inflammatory bowel disease.
Fig. 7.
Fig. 7.. DSPN deep-learning model links genetic variation to psychiatric disorders and other traits.
(A) The schematic outlines the structure of the following models: logistic regression (LR), conditional Restricted Boltzmann Machine (cRBM), conditional Deep Boltzmann Machine (cDBM), and DSPN. Nodes are partitioned into four layers (L0 to L3) and colored according to their status as visible, visible or imputed (depending on whether nodes were observed or not at test time), or hidden. (B) DSPN structure is shown in further detail, with the biological interpretation of layers L0, L1, and L3 highlighted. The GRN structure learned previously (Fig. 5A) is embedded in layers L0 and L1, with different types of regulatory linkages and functional elements shown. Co-expr. mods., coexpression modules. (C) The performance of different models is summarized, with comparisons of performance across models of different complexity and of transcriptome versus genome predictors, corresponding to being with or without imputation for the DSPN (colors highlight relevant models for each comparison). Performance accuracy is shown first, with variance explained on the liability scale in brackets. All models were tested on identical data splits, which were balanced for predicted trait and covariates (including gender, ethnicity, age, and assay). RNA-seq, cell fraction, and H3K27ac data were binarized by thresholding at median values (per gene, cell type, and enhancer, respectively), as was age (median, 51 years) when predicted. LR-gene and LR-trans are logistic models using genetic and transcriptomic predictors, respectively; DSPN-impute and DSPN-full are models with imputed intermediate phenotypes (genotype predictors only) and fully observed intermediate phenotypes (transcriptome predictors), respectively. Differential performance is shown in terms of improvement above chance, with liability variance score increases in brackets. GEN, gender; ETH, ethnicity; AOD, age of individual at death.
Fig. 8.
Fig. 8.. Interpretation of the DSPN model highlights functional associations and shared disease mechanisms.
(A) The schematic illustrates the module (MOD) and higher-order grouping (HOG) prioritization schemes. Red and blue lines represent positive and negative weights, respectively, and full and dotted lines represent first and second ranks by absolute value [creating a directed acyclic graph (DAG) with branching factor 4, rooted at L3]. Highlighted nodes (gray) in L1d show positive prioritized MODs, for which a positive path (containing an even number of negative links) exists connecting the module to the SCZ node. a1/a2 and b1/b2 highlight “best positive paths” from a and b, respectively, to SCZ in terms of absolute rank score. Associated HOGs are defined for a1/a2, containing all nodes in L1d having a path in the DAG to a1 (respectively a2), which is identically signed to the best path from a to a1 (respectively a2) (21). Positive prioritized HOGs are associated with nodes on best paths from all positive prioritized MODs; negative prioritized MODs and HOGs are calculated similarly. (B) Summary of the functional annotation scheme. (i) A total of 5024 weighted gene coexpression network analysis (WGCNA) MODs (modules and submodules) are derived from multiple data splits. (ii) MODs are prioritized as in (A) for each disorder, and (iii) associated HOGs are calculated. (iv) Gene set enrichment analysis associates functional terms with all MODs and HOGs. (v) Terms are ranked per disorder by counting the number of prioritized MODs or HOGs they associate with, and broad functional categories are defined; (vi) prioritized MODs and HOGs are linked to potentially interesting genes, enhancers, and SNPs by using GRN connectivity. proc., processing. (C) Upper segment of cross-disorder ranking of Gene Ontology (GO) and Kyoto Encyclopedia of Genes and Genomes (KEGG) functional terms, where cross-disorder ranks are assigned by using the average per-disorder rank ordering. Ranking score levels and functional categories are as in the key in (B). Highlighted ranks and terms correspond to examples shown in (D). See fig. S49 for extended ranking. sig., signaling; staph., staphylococcus; inf., infection; dop., dopamine; cGMP-PKG, guanosine 3′,5′-monophosphate–cGMP-dependent protein kinase; int., interaction. (D) Examples of associations between prioritized MODs or HOGs and genes, enhancers, and SNPs for each disorder and age model. Associated functional terms and categories are as in (B). A table providing coordinates of eQTLs and cQTLs for all examples shown is provided in table S13. Chem. syn. trans., chemical synaptic transmission.

References

    1. Kessler RC et al., Design and field procedures in the US National Comorbidity Survey Replication Adolescent Supplement (NCS-A). Int. J. Methods Psychiatr. Res 18, 69–83 (2009). doi: 10.1002/mpr.279; pmid: 19507169 - DOI - PMC - PubMed
    1. Wilson PW et al., Prediction of coronary heart disease using risk factor categories. Circulation 97, 1837–1847 (1998). doi: 10.1161/01.CIR.97.18.1837; pmid: 9603539 - DOI - PubMed
    1. Weinstein JN et al., The Cancer Genome Atlas Pan-Cancer analysis project. Nat. Genet 45, 1113–1120 (2013). doi: 10.1038/ng.2764; pmid: 24071849 - DOI - PMC - PubMed
    1. Lloyd-Jones DM et al., Prediction of lifetime risk for cardiovascular disease by risk factor burden at 50 years of age. Circulation 113, 791–798 (2006). doi: 10.1161/CIRCULATIONAHA.105.548206; pmid: 16461820 - DOI - PubMed
    1. Stratton MR, Campbell PJ, Futreal PA, The cancer genome. Nature 458, 719–724 (2009). doi: 10.1038/nature07943; pmid: 19360079 - DOI - PMC - PubMed

Publication types

Grants and funding