. 2019 Feb;179(2):519-532.
doi: 10.1104/pp.18.01228. Epub 2018 Dec 13.

A Golgi-Released Subpopulation of the Trans-Golgi Network Mediates Protein Secretion in Arabidopsis

Affiliations

A Golgi-Released Subpopulation of the Trans-Golgi Network Mediates Protein Secretion in Arabidopsis

Tomohiro Uemura et al. Plant Physiol. 2019 Feb.

Abstract

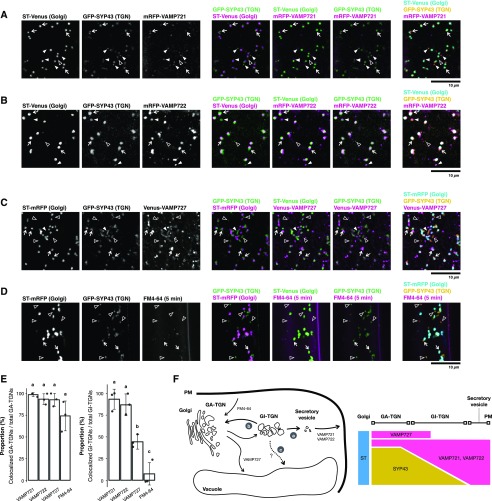
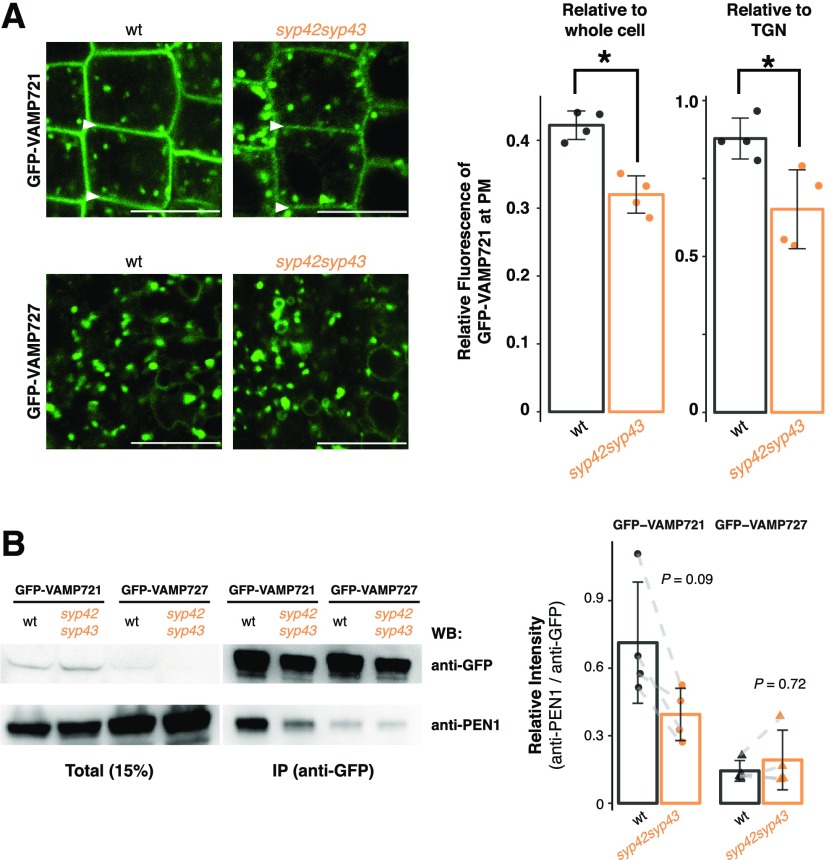
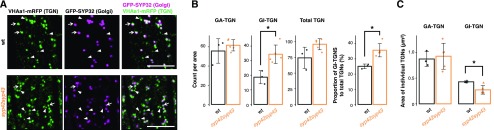
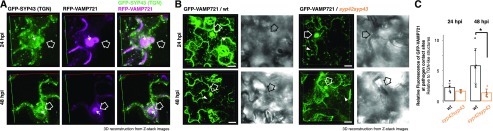
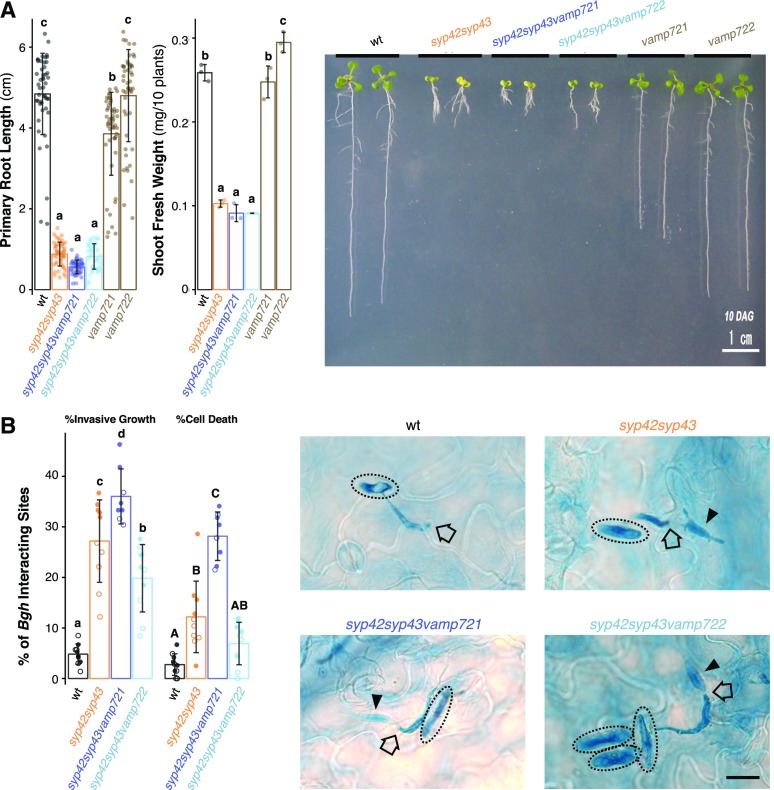
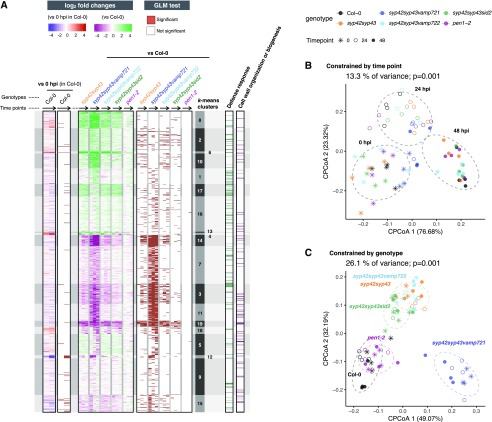
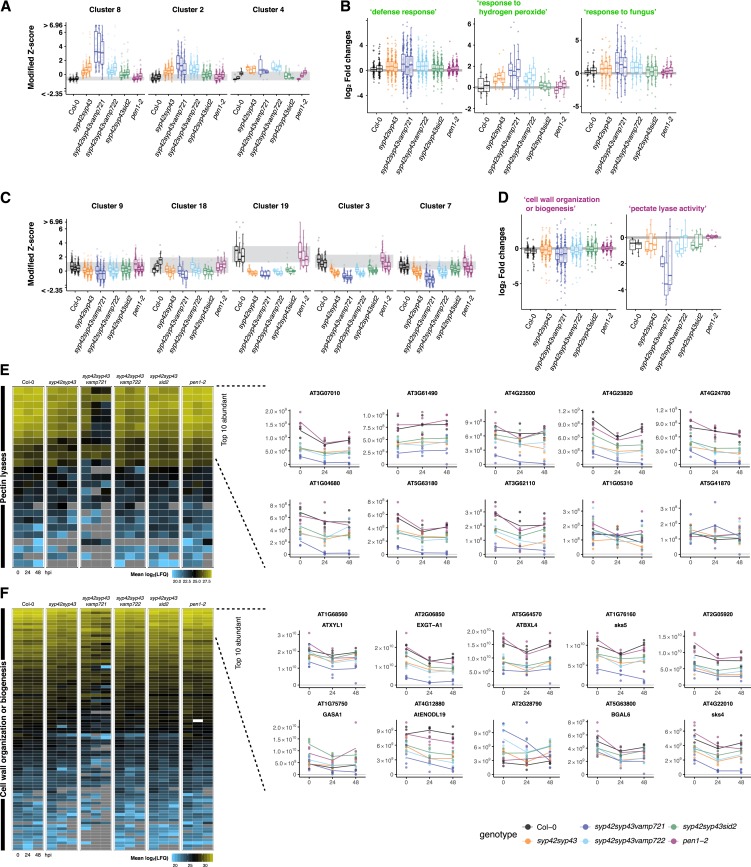
Spatiotemporal coordination of protein trafficking among organelles is essential for eukaryotic cells. The post-Golgi interface, including the trans-Golgi network (TGN), is a pivotal hub for multiple trafficking pathways. The Golgi-released independent TGN (GI-TGN) is a compartment described only in plant cells, and its cellular and physiological roles remain elusive. In Arabidopsis (Arabidopsis thaliana), the SYNTAXIN OF PLANTS (SYP) 4 group Qa-SNARE (soluble N-ethylmaleimide) membrane fusion proteins are shared components of TGN and GI-TGN and regulate secretory and vacuolar transport. Here we reveal that GI-TGNs mediate the transport of the R-SNARE VESICLE-ASSOCIATED MEMBRANE PROTEIN (VAMP) 721 to the plasma membrane. In interactions with a nonadapted powdery mildew pathogen, the SYP4 group of SNAREs is required for the dynamic relocation of VAMP721 to plant-fungus contact sites via GI-TGNs, thereby facilitating complex formation with its cognate SNARE partner PENETRATION1 to restrict pathogen entry. Furthermore, quantitative proteomic analysis of leaf apoplastic fluid revealed constitutive and pathogen-inducible secretion of cell wall-modification enzymes in a SYP4- and VAMP721-dependent manner. Hence, the GI-TGN acts as a transit compartment between the Golgi apparatus and the plasma membrane. We propose a model in which the GA-TGN matures into the GI-TGN and then into secretory vesicles by increasing the abundance of VAMP721-dependent secretory pathway components.


Figures

Figure 1.
Figure 1.
The GI-TGN functions in the protein secretory pathway. A, Representative confocal images of Arabidopsis roots expressing GFP-SYP43 (TGN), ST-Venus (trans-Golgi), and mRFP-VAMP721 (TGN-PM). B, Representative confocal images of Arabidopsis roots expressing GFP-SYP43 (TGN), ST-Venus (trans-Golgi), and mRFP-VAMP722 (TGN-PM). C, Representative confocal images of Arabidopsis roots expressing GFP-SYP43 (TGN), ST-Venus (trans-Golgi), and mRFP-VAMP727 multivesicular endosome (MVE). D, Representative confocal images of Arabidopsis roots expressing GFP-SYP43 (TGN) and ST-mRFP (trans-Golgi) stained by FM4-64 for 5 min. Arrowheads indicate GI-TGNs that are associated with (white filled arrowheads) or segregated from (outlined arrowheads) the coexpressed R-SNAREs or FM4-64. White arrows indicate GA-TGNs. E, Proportion of GA- and GI-TGNs that are colocalized with VAMP721, VAMP722, VAMP727, or FM4-64 signals relative to total GA- and GI-TGNs, respectively (n = 3; 21 ∼ 33 TGNs in total for each marker). Letters indicate statistical significance based on Tukey’s HSD test corrected for multiple comparisons (α = 0.05). F, Schematic representation of the GI-TGN-mediated trafficking pathways. A part of the GI-TGN further matures and/or fragments into secretory vesicles by increasing the abundance of the secretory pathway components, including VAMP721 and VAMP722 R-SNAREs (a). The rest of the GI-TGNs may revert to GA-TGNs (b) or possibly mediate another trafficking pathway such as the vacuolar transport pathway that is independent of the VAMP727 R-SNARE (c). Scale bars = 10 µm.
Figure 2.
Figure 2.
The R-SNARE VAMP721 operates in the SYP4-dependent secretory pathway. A, Representative confocal images of Arabidopsis roots expressing GFP-VAMP721 and GFP-VAMP727 in the wild-type (wt; left) and syp42syp43 (right) mutant plants. White arrowheads indicate the PM. The graph shows the relative fluorescent intensity of GFP-VAMP721 at the PM compared with whole cell (left; n = 8) or to TGNs (right; n = 8) in the wild-type and syp42syp43 mutant plants. B, Protein extracts of Arabidopsis shoots expressing GFP-VAMP721 and GFP-VAMP727 in the wild-type and syp42syp43 mutant plants were immunoprecipitated with anti-GFP antibody and detected with anti-PEN1 and anti-GFP antibodies by western blotting. The graph shows signal intensities of coimmunoprecipitated PEN1 normalized by the signals from GFP-VAMP721 or GFP-VAMP721 (n = 14). Asterisks in (A) indicate statistical significance based on Student’s t test (α = 0.05). P values in (B) calculated using Student’s two-sample paired t test with Bonferroni correction for multiple comparisons (α = 0.05). Bar plots are shown with mean ±sd and raw data points. Scale bars = 10 µm.
Figure 3.
Figure 3.
Relative abundance of GA- and GI-TGNs is controlled by SYP42 and SYP43 Qa-SNAREs. A, Representative confocal images of the Arabidopsis roots expressing GFP-SYP32 (cis-Golgi) and VHAa1-mRFP (TGN) in the wild-type (wt) and syp42syp43 mutant plants. B, The number of GA-, GI-, and total TGNs were counted per area and used to calculate the proportion of GI-TGNs to total TGNs (n = 8). C, The size of GA- and GI-TGNs were measured. Asterisks indicate statistical significance based on a Student’s t test with Bonferroni correction for multiple comparisons (α = 0.05). White arrows and white arrowheads indicate GA- and GI-TGNs, respectively. Bar plots are shown with mean ±sd and raw data points. Scale bars = 10 µm.
Figure 4.
Figure 4.
SYP4-dependent accumulation of GFP-VAMP721 at Bgh contact sites. A, Representative three-dimensional (3D) reconstructed images of Arabidopsis leaf epidermal cells expressing GFP-SYP43 and mRFP-VAMP721 at 24 and 48 h post inoculation (hpi) of Bgh. White arrows indicate the extracellular space between the plant and fungal cells. Outlined arrows indicate fungal contact sites. B, Representative 3D reconstructed images of the Arabidopsis leaf epidermal cells expressing GFP-VAMP721 at 24 and 48 hpi of Bgh in the wild-type (wt) and syp42syp43 mutant plants. C, Relative fluorescent intensity at the focal site, outlined arrows in (B), compared with TGNs, white arrowheads in (B), in the wild-type and syp42syp43 cells (n = 23). Asterisks indicate statistical significance based on a Student’s two-sample t test with Bonferroni correction for multiple comparisons (α = 0.05). Bar plots are shown with mean ±sd and raw data points. Scale bars = 10 µm. Lines in the 3D reconstructed images correspond to the x/y/z axes.
Figure 5.
Figure 5.
SYP4 and VAMP721 operate in overlapping pathways in plant growth and extracellular defense to Bgh. A, Representative images showing growth phenotypes of single and multiple mutants of syp42, syp43, vamp721, and vamp722. Primary root length (n = 284) and shoot fresh weight (n = 32) of ten-day-old seedlings was measured. Scale bar = 1 cm. B, Frequency of fungal invasive growth (haustorium formation) and cell death at Bgh interaction sites on the wild-type (wt), syp42syp43, syp42syp43vamp721, and syp42syp43vamp722 leaves were scored at 24 hpi. Representative micrographs of leaves from respective genotypes inoculated with Bgh (24 hpi) and stained by trypan blue. Dotted circles, black outlined arrows, and black arrowheads indicate Bgh conidiospores, appressoria, and haustoria, respectively. Bar plots are shown with mean ±sd and raw data points. Different shapes indicate independent experiments. Letters indicate statistical significance based on Tukey’s HSD test corrected for multiple comparisons (α = 0.05). Scale bar = 10 µm.
Figure 6.
Figure 6.
Constitutive and pathogen-inducible shift of apoplastic proteome by disruption of the SYP4-VAMP721 pathway. Proteomic alterations in leaf apoplastic fluids of the wild-type, syp42syp43, syp42syp43vamp721, syp42syp43vamp722, syp42syp43sid2, and pen1-2 leaves at 0, 24, and 48 h post inoculation (hpi) of Bgh. A, Heatmaps showing log2-scale fold changes either at 24 and 48 hpi compared with 0 hpi in the wild type, or at 0, 24, and 48 hpi compared with the wild type at the respective timepoint, and statistical significance based on a generalized linear model (GLM) likelihood ratio test (α = 0.05). Shown are k-means clusters (k = 19). Black arrows indicate time points: 0 hpi, 24 hpi, to 48 hpi. The log2-scale fold changes values are saturated at 1% and 99% quantiles. B and C, Canonical analyses of principal coordinates identify 13.3% and 26.1% of variance significantly explained by time points and genotypes, respectively. P values are based on ANOVA-like permutation analysis (n = 999). Ellipses correspond to multivariate normal distribution with 75% confidence level.
Figure 7.
Figure 7.
SYP4-dependent secretion of cell wall-modification enzymes. A and C, Boxplots showing median-centered z scores, saturated at 1% and 99% quantiles. Clusters correspond to k-mean clusters (those in Fig. 5A). Three boxplots within each genotype indicate 0, 24, and 48 hpi from left to right. B and D, Log2-scale fold changes of the proteins assigned with the indicated GO terms. Two boxplots within Col-0 indicate fold changes at 24 and 48 hpi (left and right) compared with 0 hpi. Three boxplots within each mutant indicate fold changes at 0, 24, and 48 hpi (from left to right) compared with the respective timepoint of Col-0. E and F, Relative abundance of the proteins annotated as pectin lyases (E) or assigned with the GO term “cell wall organization of biogenesis” (F) are shown as heatmaps with mean log2-scale label-free quantification (LFQ) values. Relative abundance of top ten abundant proteins for each category are also shown as line plots with mean linear-scale LFQ values with individual data points.

Similar articles

Cited by

References

    1. Assaad FF, Qiu JL, Youngs H, Ehrhardt D, Zimmerli L, Kalde M, Wanner G, Peck SC, Edwards H, Ramonell K, et al. (2004) The PEN1 syntaxin defines a novel cellular compartment upon fungal attack and is required for the timely assembly of papillae. Mol Biol Cell 15: 5118–5129 - PMC - PubMed
    1. Bartsch M, Gobbato E, Bednarek P, Debey S, Schultze JL, Bautor J, Parker JE (2006) Salicylic acid-independent ENHANCED DISEASE SUSCEPTIBILITY1 signaling in Arabidopsis immunity and cell death is regulated by the monooxygenase FMO1 and the Nudix hydrolase NUDT7. Plant Cell 18: 1038–1051 - PMC - PubMed
    1. Birkenbihl RP, Liu S, Somssich IE (2017) Transcriptional events defining plant immune responses. Curr Opin Plant Biol 38: 1–9 - PubMed
    1. Boutté Y, Jonsson K, McFarlane HE, Johnson E, Gendre D, Swarup R, Friml J, Samuels L, Robert S, Bhalerao RP (2013) ECHIDNA-mediated post-Golgi trafficking of auxin carriers for differential cell elongation. Proc Natl Acad Sci USA 110: 16259–16264 - PMC - PubMed
    1. Brito N, Espino JJ, González C (2006) The endo-β-1,4-xylanase xyn11A is required for virulence in Botrytis cinerea. Mol Plant Microbe Interact 19: 25–32 - PubMed

Publication types

MeSH terms