. 2019 Feb 6;39(6):949-969.
doi: 10.1523/JNEUROSCI.1726-18.2018. Epub 2018 Dec 13.

The Immunosuppressant Macrolide Tacrolimus Activates Cold-Sensing TRPM8 Channels

Affiliations

The Immunosuppressant Macrolide Tacrolimus Activates Cold-Sensing TRPM8 Channels

José Miguel Arcas et al. J Neurosci. .

Abstract

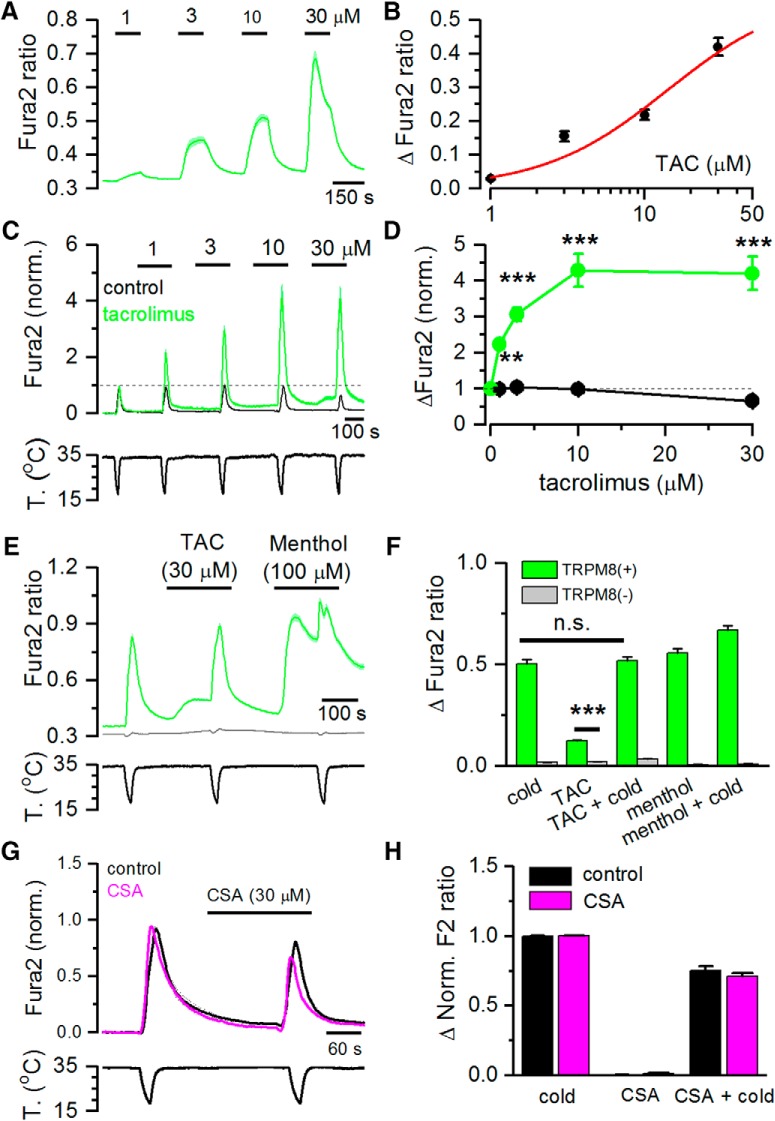
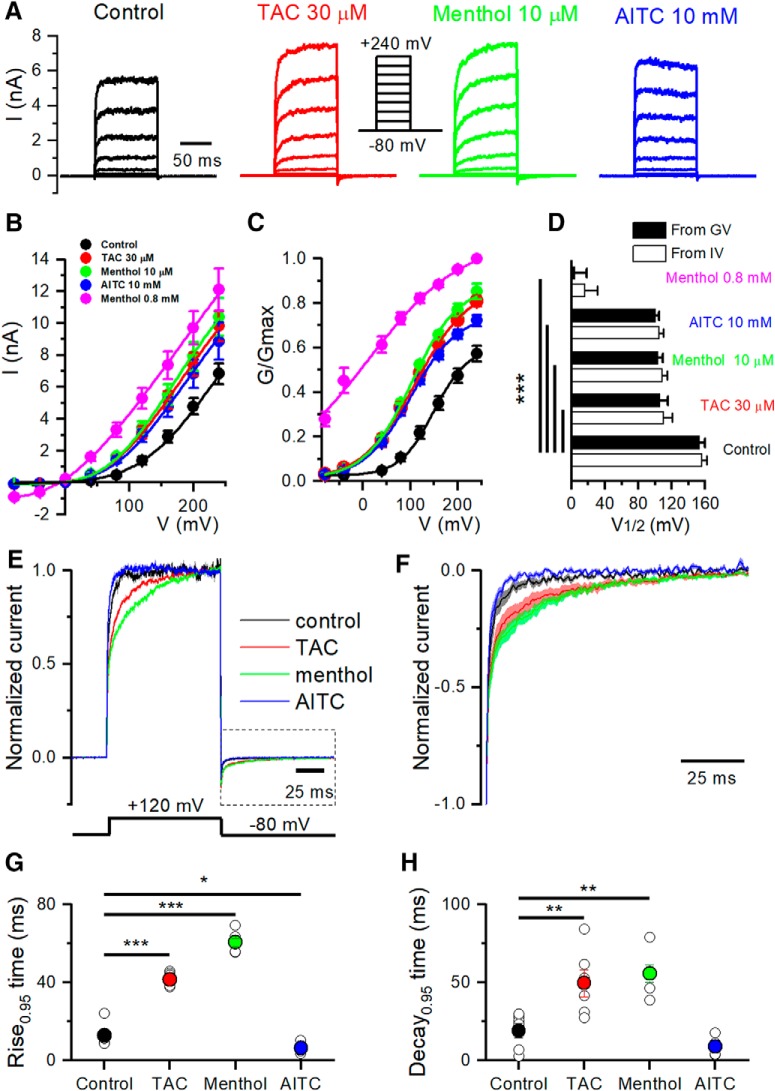
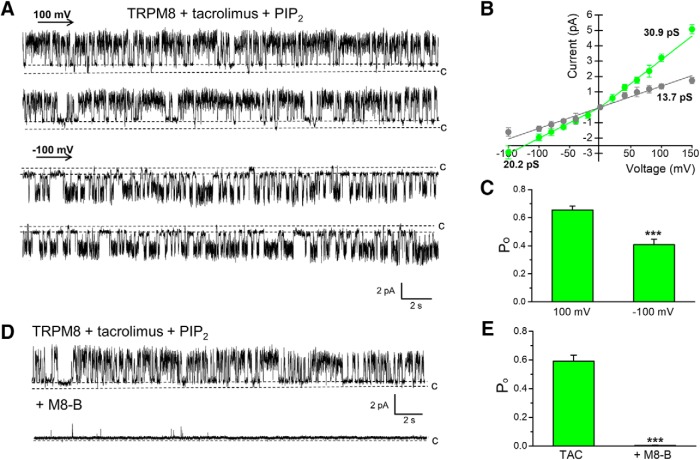
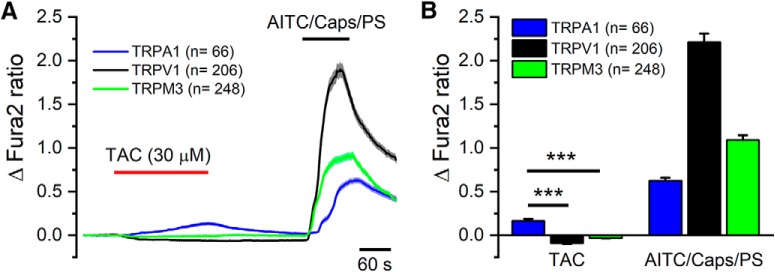
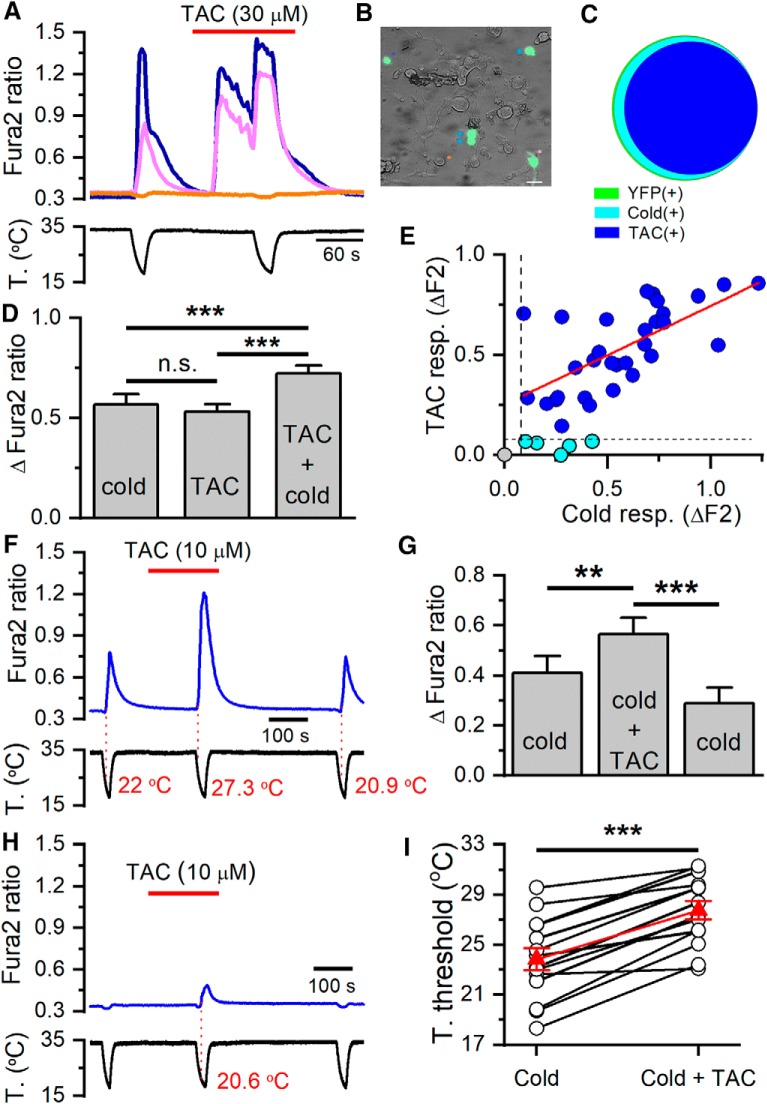
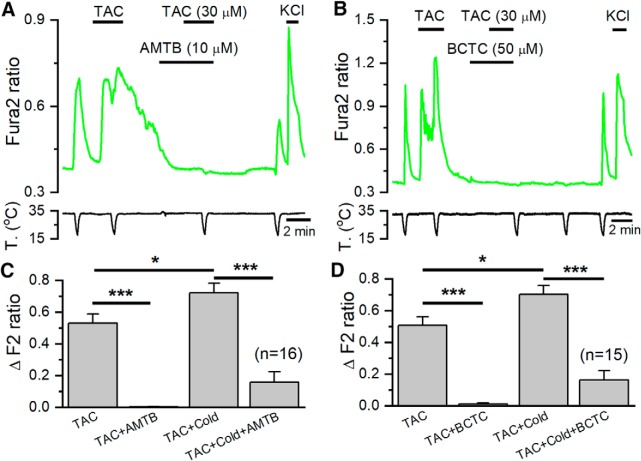
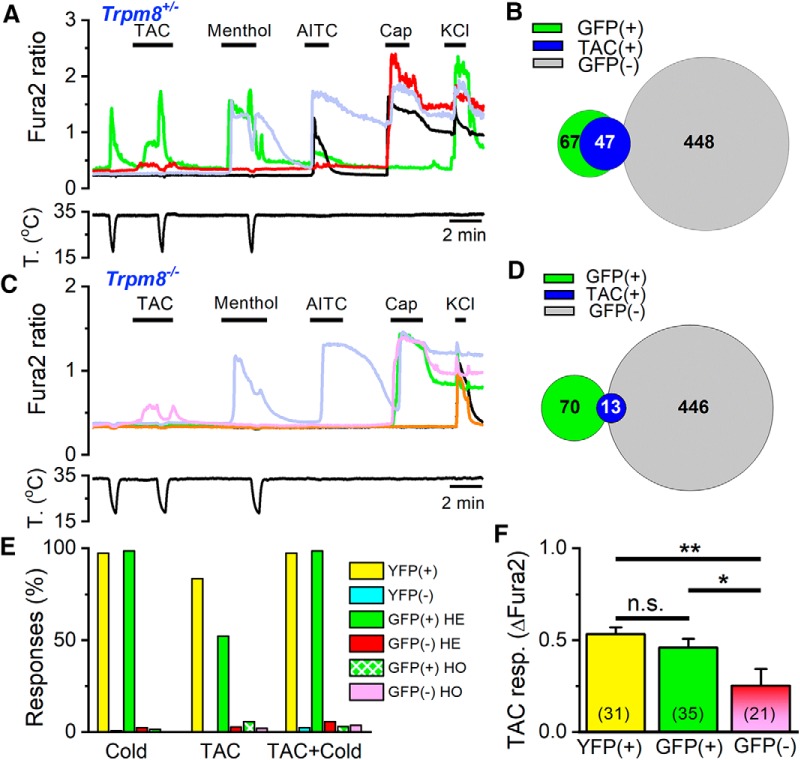
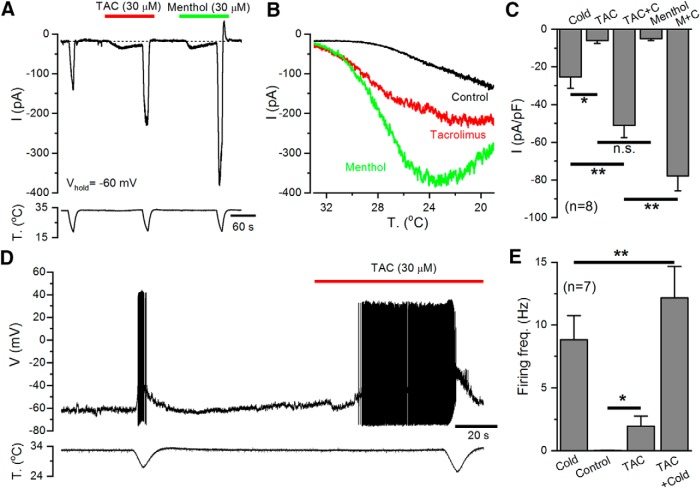
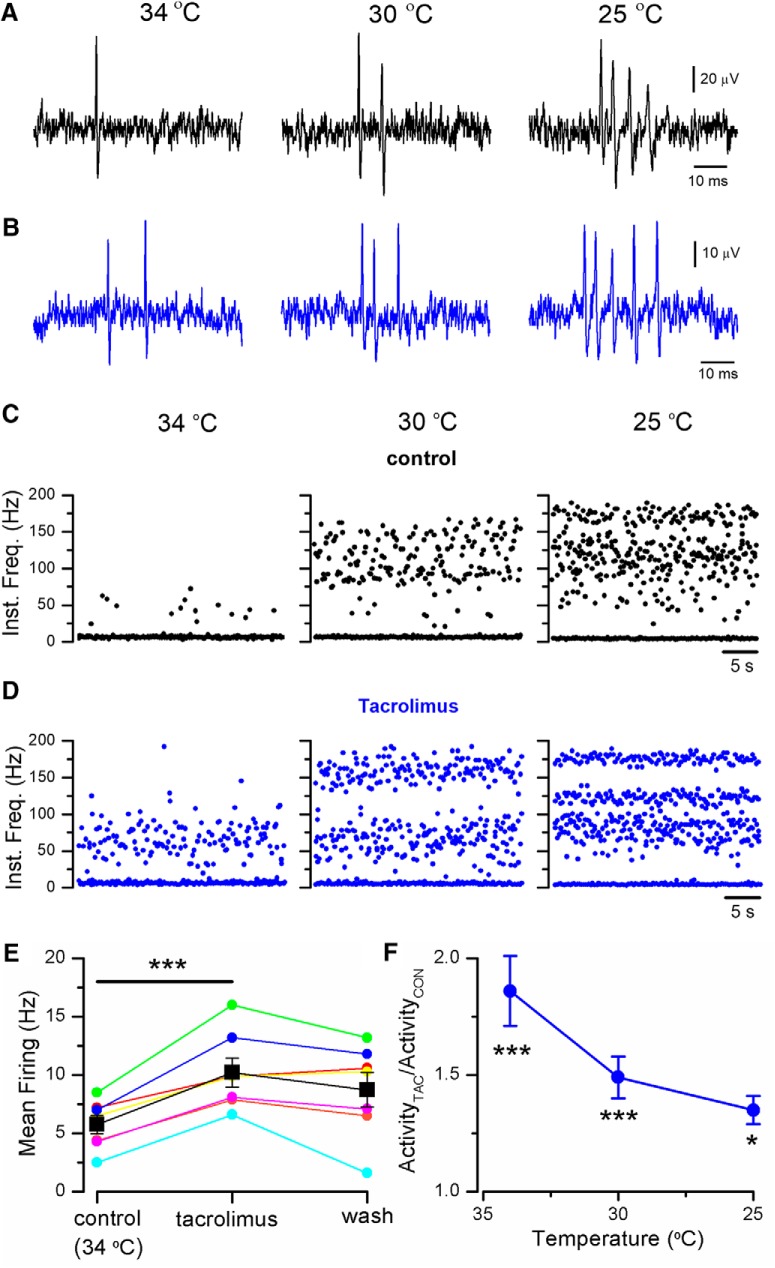
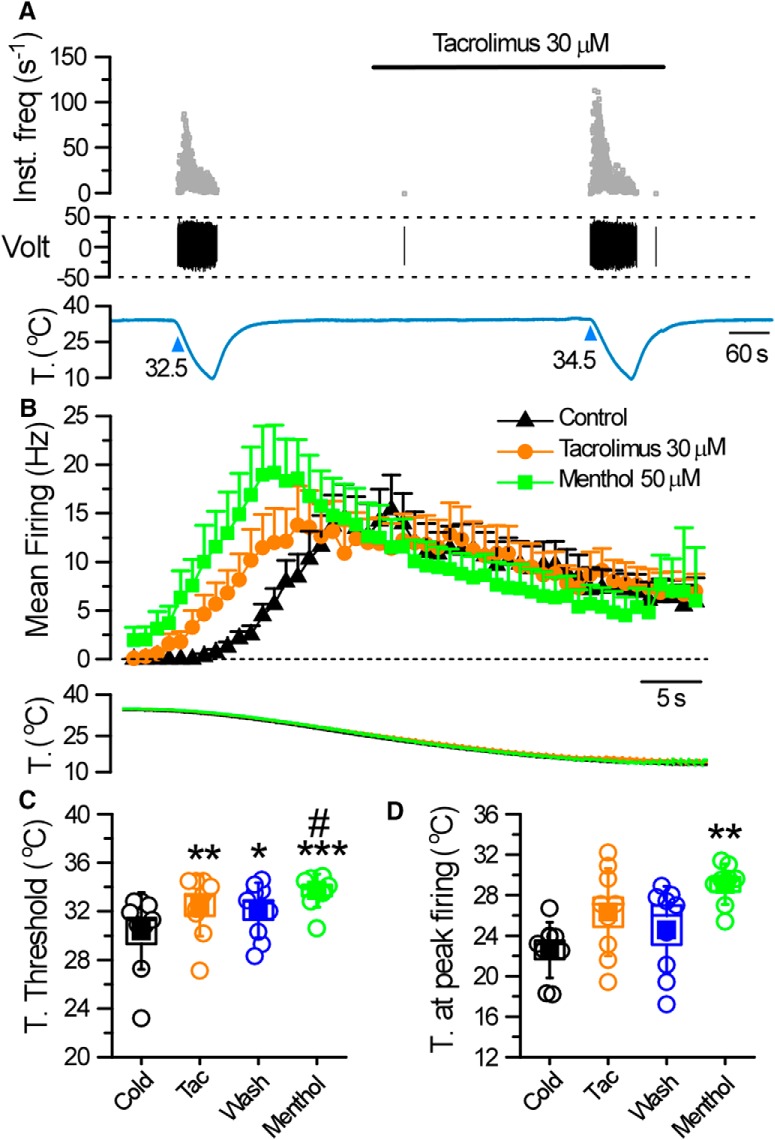
TRPM8 is a polymodal, nonselective cation channel activated by cold temperature and cooling agents that plays a critical role in the detection of environmental cold. We found that TRPM8 is a pharmacological target of tacrolimus (FK506), a macrolide immunosuppressant with several clinical uses, including the treatment of organ rejection following transplants, treatment of atopic dermatitis, and dry eye disease. Tacrolimus is an inhibitor of the phosphatase calcineurin, an action shared with cyclosporine. Tacrolimus activates TRPM8 channels in different species, including humans, and sensitizes their response to cold temperature by inducing a leftward shift in the voltage-dependent activation curve. The effects of tacrolimus on purified TRPM8 in lipid bilayers demonstrates conclusively that it has a direct gating effect. Moreover, the lack of effect of cyclosporine rules out the canonical signaling pathway involving the phosphatase calcineurin. Menthol (TRPM8-Y745H)- and icilin (TRPM8-N799A)-insensitive mutants were also activated by tacrolimus, suggesting a different binding site. In cultured mouse DRG neurons, tacrolimus evokes an increase in intracellular calcium almost exclusively in cold-sensitive neurons, and these responses were drastically blunted in Trpm8 KO mice or after the application of TRPM8 antagonists. Cutaneous and corneal cold thermoreceptor endings are also activated by tacrolimus, and tacrolimus solutions trigger blinking and cold-evoked behaviors. Together, our results identify TRPM8 channels in sensory neurons as molecular targets of the immunosuppressant tacrolimus. The actions of tacrolimus on TRPM8 resemble those of menthol but likely involve interactions with other channel residues.SIGNIFICANCE STATEMENT TRPM8 is a polymodal TRP channel involved in cold temperature sensing, thermoregulation, and cold pain. TRPM8 is also involved in the pathophysiology of dry eye disease, and TRPM8 activation has antiallodynic and antipruritic effects, making it a prime therapeutic target in several cutaneous and neural diseases. We report the direct agonist effect of tacrolimus, a potent natural immunosuppressant with multiple clinical applications, on TRPM8 activity. This interaction represents a novel neuroimmune interface. The identification of a clinically approved drug with agonist activity on TRPM8 channels could be used experimentally to probe the function of TRPM8 in humans. Our findings may explain some of the sensory and anti-inflammatory effects described for this drug in the skin and the eye surface.

Keywords: TRP channel; cornea; neuroimmune; pain; thermoreceptor; trigeminal.


Figures

Figure 1.
Figure 1.
TAC activates recombinant TRPM8 channels and potentiates cold-evoked responses. A, Average ± SEM fura-2 ratio changes in HEK293 cells stably expressing rat TRPM8 during sequential application of TAC at different concentrations (n = 105). B, Dose–response curve of TAC effects on TRPM8-expressing cells. Data have been fitted with a logistic function (EC50 = 14.1 ± 25.9 μm). C, Average ± SEM time course of fura-2 ratio in HEK293-expressing mouse TRPM8 during consecutive application of cold pulses in control solution (black trace, n = 15) or in the presence of increasing TAC concentrations (green trace, n = 16). Bottom, Time course of the corresponding temperature ramps. In the absence of TAC, the response to cold was relatively stable, whereas in the presence of TAC, the response to cold was strongly sensitized. Responses in individual cells have been normalized to their response to the first cooling pulse. D, Summary plot of the effect of different doses of TAC on the amplitude of cold-evoked responses in mTRPM8 cells. **p < 0.01 (ANOVA test in combination with Bonferroni's post hoc test). ***p < 0.001 (ANOVA test in combination with Bonferroni's post hoc test). E, Average ± SEM fura-2 ratio responses to cold, TAC (30 μm), and menthol (100 μm) in HEK293 cells transiently transfected with human TRPM8 and GFP. Green represents GFP(+) cells (n = 132). Gray represents GFP(−) cells (n = 87). F, Summary of mean responses in cells transfected with hTRPM8 (green bars) to the different agonists. Gray represents the responses of untransfected, GFP(−) cells. TAC produced a significant activation of hTRPM8 (***p < 0.001; unpaired Student's t test). G, Average ± SEM fura-2 ratio changes in HEK293 cells stably expressing rat TRPM8 during application of two cooling ramps. For the black traces (n = 25), cooling ramps were delivered in control solution. For the pink traces (n = 107), the second cooling ramp was applied in the presence of 30 μm cyclosporine (CSA). H, Histogram summarizing the effects of cyclosporine on cold-evoked calcium responses during the protocol shown in G. No significant differences were found between the cells perfused with control solution or cyclosporine (unpaired Student's t test).
Figure 2.
Figure 2.
TAC activates TRPM8-mediated whole-cell currents in HEK293 cells. A, Representative time course of whole-cell currents at −100 and 100 mV in HEK293 cell transiently transfected with mTRPM8 during application of agonists. Bottom, Simultaneous recording of the bath temperature during the experiment. B, I–V relationship of responses shown in A, obtained with a 400 ms voltage ramp from −100 to 150 mV. The color of individual traces matches the color at each particular time point in A. TAC evokes a nonselective cationic current with typical TRPM8 features and potentiates the cold-evoked response. C, Bar histogram summarizing the mean current density values at 100 and −100 mV to the different stimuli shown in A, with the same color code. Statistical differences were evaluated by a one-way ANOVA, followed by Bonferroni's post hoc test. D, Representative time course of whole-cell currents at −100 and 100 mV during a protocol in which the effect of AMTB was studied. AMTB 10 μm totally abolished TAC-evoked currents. Bottom, Simultaneous recording of the bath temperature during the experiment. E, I–V relationship of responses shown in D. The color of the I–V curves matches the colored time points in D. AMTB also blocks the voltage-dependent activation of TRPM8 at basal temperature. F, Bar histogram summarizing the mean current density values at 100 mV to the different stimuli applied in D. Statistical differences were evaluated by a one-way ANOVA, followed by Bonferroni's post hoc test. *p < 0.05, **p < 0.01, ***p < 0.001.
Figure 3.
Figure 3.
Biophysical characterization of TAC effects on TRPM8 gating. A, Whole-cell TRPM8 currents in response to the indicated voltage step protocol (from −80 to 240 mV, Δv = 40 mV) in control conditions and in the presence of TAC (30 μm), menthol (10 μm), and AITC (10 mm) at 24°C. Note the variable effect of agonists on activation kinetics. B, Averaged (n = 6) steady-state I–V curves extracted from individual cells after application of Protocol A. The lines indicate the fitting to a linearized Boltzmann equation (see Materials and Methods). C, Averaged (n = 6) voltage dependence activation curves in control conditions and in the presence of the different agonists. Conductance (G) was calculated as the steady-state current divided by the driving force (Driving force = Vtest − Erev), and normalized to the estimated maximal conductance (Gmax), which was the G value at 240 mV in the presence of 0.8 mm menthol. D, Mean (n = 6) V1/2 values calculated from fitting the individual I–V curves to the linearized Boltzmann equation (white bars) or the individual G/GmaxV curves fitted to the Boltzmann equation (black bars). All three agonists produced similar shifts in V1/2 values at the indicated concentrations. Statistical differences were evaluated by a one-way ANOVA, followed by Bonferroni's post hoc test. E, Averaged TRPM8 current during a voltage step from −80 to 120 mV, in control condition and in the presence of the different agonists. Currents were normalized to their steady-state amplitude after baseline subtraction. F, Averaged ± SEM TRPM8 deactivation kinetics at −80 mV obtained from current tails after a voltage step to 120 mV (box bounded by dotted line in E), in control condition and in the presence of the different agonists. The current was normalized to the maximum value, and baseline was subtracted. G, Mean values of the current activation time course, measured from baseline to 95% amplitude, for voltage steps to 120 mV. H, Mean values of current deactivation time course at −80 mV, measured from baseline to 95% amplitude, following a voltage step to 120 mV. F, G, Statistical differences were evaluated with a one-way ANOVA, followed by Bonferroni's post hoc test. *p < 0.05, **p < 0.01, ***p < 0.001.
Figure 4.
Figure 4.
TAC activates purified TRPM8 in planar lipid bilayers. A, Representative single-channel recordings of TRPM8 obtained at 100 mV and −100 mV showing the activation with 30 μm TAC in the presence of 2.5 μm PIP2. B, I–V curve of TRPM8 single-channel current during TAC activation at different membrane potentials, showing the main conductance of outward and inward currents (green trace), and a lower subconductance state (gray trace). C, Bar graph represents open probability (Po) values at 100 and −100 mV in the presence of TAC and PIP2. Data represent mean ± SEM from 13 experiments; number of events = 28,935. Po was significantly higher at 100 mV (***p < 0.001, paired Student's t test). D, Representative current traces demonstrating inhibition of TAC-induced TRPM8 activity with M8-B (20 μm). TRPM8 was activated with 30 μm TAC in the presence of 2.5 μm PIP2. Traces were obtained at 100 mV. E, Bar graph summarizing the inhibition produced by M8-B on Po. Data represent mean ± SEM from four experiments (***p < 0.001, paired Student's t test).
Figure 5.
Figure 5.
TAC activates the menthol- and the icilin-insensitive TRPM8 mutants. A, Averaged ± SEM fura-2 ratio fluorescence of mouse TRPM8-transfected HEK293 cells during cooling, TAC (30 μm) and the combined application of TAC and cooling. Records have been baseline-subtracted and the average trace normalized to the initial response to cold. Top to bottom, Calcium responses of WT TRPM8, the menthol-insensitive TRPM8–Y745H mutant, and a representative recording of the temperature time course in the chamber during the recording. B, Histogram of mean response amplitudes to the different stimuli, normalized to the initial cold response. Note the lack of potentiation of the cold-evoked response by TAC in the menthol-insensitive mutant. Statistical differences were evaluated by an unpaired Student's t test. C, Representative traces of whole-cell recordings exploring the effect of cold and TAC in two different TRPM8 mutants. Top to bottom, Currents, measured at −100 and 100 mV, in WT mouse TRPM8, the menthol-insensitive TRPM8–Y745H mutant, and the icilin-insensitive TRPM8–N799A mutant. Bottom, Representative recording of the temperature change in the chamber during the protocol. D, Histogram of the average current values to the different agonists in TRPM8 WT and the different mutants during the protocol shown in C. For each cell, current responses were normalized to the initial cold-evoked response. Statistical differences for the response to each agonist in the different TRPM8 constructs were evaluated with a one-way ANOVA, followed by Bonferroni's post hoc test. *p < 0.05, **p < 0.01.
Figure 6.
Figure 6.
TAC activates human TRPA1 channels. A, Averaged ± SEM fura-2 fluorescence ratio of HEK292 cells transfected with human TRPA1 (blue trace), rat TRPV1 (black trace), or mouse TRPM3 (green trace) during applications of TAC (30 μm) and their canonical agonists capsaicin (100 nm), AITC (50 μm), and pregnenolone sulfate (PS, 50 μm). B, Bar histogram summarizing the effect of TAC or the canonical agonists, capsaicin, AITC, or PS, on fura-2 fluorescence ratio. Individual records have been baseline-subtracted. TAC produced a significant elevation in [Ca2+]i in TRPA1-transfected cells compared with TRPV1- or TRPM3-transfected cells (***p < 0.001, one-way ANOVA followed by Bonferroni's post hoc test). ***p < 0.001.
Figure 7.
Figure 7.
TAC activates cold-sensitive neurons selectively. A, Ratiometric [Ca2+] measurement from fura-2 loaded cultured DRG neurons in Trpm8BAC-EYFP mice. Two cold-sensitive neurons (blue and magenta traces) increased their [Ca2+] level during the cooling ramp. The same neurons also responded to 30 μm TAC, and their response to cold was potentiated. The cold-insensitive neuron (orange trace) did not respond to any of these stimuli. B, Representative image of a DRG culture from a Trpm8BAC-EYFP mouse. A, Traces correspond to the neurons marked with the same colored asterisk: orange for YFP(−), blue and magenta for YFP(+). Three additional YFP(+) neurons, marked with blue arrowheads, also responded to cold and TAC. Scale bar, 20 μm. C, Venn diagram showing the strong overlap between YFP(+) neurons (green, n = 37), the response to cooling (cyan, n = 36), and the response to TAC (blue, n = 31). In this sample, none of the YFP(−) neurons (n = 130) responded to TAC. D, Bar histogram showing the average amplitude of the responses to cold, to TAC, and to cold in the presence of TAC. Amplitudes were similar for cold and TAC, whereas the responses to cold were significantly higher in the presence of TAC. One-way ANOVA for repeated measures followed by Bonferroni's post hoc test. E, Correlation between amplitude of cold- and TAC-evoked responses in individual DRG neurons. Black dotted lines indicate the threshold amplitude established for considering a positive response. Blue points represent the neurons that responded to cold and TAC (n = 31). Cyan points represent the neurons that responded to cold but did not respond to TAC (n = 5). Note the small cold-evoked response in neurons unresponsive to TAC. Gray point represents the single YFP(+) neuron that did not respond to cold or TAC. The linear fit to the blue points (red line) yielded a correlation coefficient (r2) of 0.42. F, Representative trace of fura-2 ratio fluorescence in a DRG neuron during three consecutive cooling ramps. Note the strong, reversible potentiation of the cold-evoked response in the presence of 10 μm TAC. Red numbers indicate the temperature at which the measured signal (F340/F380) deviated by at least 4 times the SD of its baseline (i.e., temperature threshold). G, Bar histogram summarizing the effect of 10 μm TAC on the amplitude of the cold-evoked response. One-way ANOVA for repeated measures followed by Bonferroni's post hoc test. H, Time course of fura-2 ratio in a YFP(+), which was not activated in control conditions (i.e., cold insensitive) but was recruited in the presence of 10 μm TAC. I, Temperature threshold of individual YFP(+) neurons to cold or cold plus 10 μm TAC. The mean temperature threshold (red triangles) shifted from 23.9 ± 0.9°C in control solution to 27.8 ± 0.8°C in the presence of 10 μm TAC (p < 0.001, n = 14, paired Student's t test). **p < 0.01, ***p < 0.001.
Figure 8.
Figure 8.
TRPM8 antagonists block the excitatory effects of TAC on mice DRG neurons. A, Ratiometric [Ca2+] levels in a fura-2 AM-loaded cultured DRG neuron from a Trpm8BAC-EYFP mouse, showing the response to cold and TAC in control conditions and in the presence of the TRPM8 blocker AMTB (10 μm). B, A similar protocol in the presence of BCTC (50 μm), a different, structurally unrelated, TRPM8 blocker. C, Bar histograms summarizing the effects of AMTB (n = 16), and (D) BCTC (n = 15) on cold- and TAC-evoked responses. Statistical differences evaluated with one-way ANOVA followed by Bonferroni post hoc test. *p < 0.05, ***p < 0.001.
Figure 9.
Figure 9.
TRPM8 is the principal mediator of the excitatory effects of TAC on DRG neurons. A, Representative traces of fura-2 ratio fluorescence in a Trpm8EGFPf/+ DRG culture. Consecutive applications of cold, TAC (30 μm), menthol (100 μm), AITC (100 μm), capsaicin (100 nm), and high K+ (30 mm) were used to define the phenotype of each neuron. The GFP(+) neuron (green trace) is activated by cold, TAC, and menthol. A GFP(−) neuron (red trace) is not activated by cold or menthol but shows a small response to TAC; typically, these neurons are activated by capsaicin. B, Venn diagram summarizing the responses to TAC in GFP(+) and GFP(−) neurons in Trpm8EGFPf/+ mice. C, Representative traces of fura-2 ratio fluorescence in cultured DRG neurons from a Trpm8 KO mouse. Same protocol as in A. Note the inhibition of the small TAC response by cooling in a GFP(−) neuron (pink trace). A GFP(+) neuron (green trace) does not respond to cold or menthol but responds to capsaicin. D, Venn diagram summarizing the responses to TAC in GFP(+) and GFP(−) neurons in Trpm8 KO mice. E, Summary of responses (in percentage of total neurons) to cold, TAC, and TAC plus cold in Trpm8BAC-EYFP, Trpm8EGFPf/+, and Trpm8EGFPf/EGFPf mice. For each mouse line, neurons have been separated as fluorescent or nonfluorescent. F, Mean amplitude of TAC responses in fluorescent (TRPM8BAC-EYFP and Trpm8EGFPf/+) and nonfluorescent neurons (Trpm8EGFPf/+ and Trpm8EGFPf/EGFPf). Differences in amplitude between fluorescent and nonfluorescent neurons were statistically significant (one-way ANOVA). *p < 0.05, **p < 0.01.
Figure 10.
Figure 10.
TAC increases the excitability of cold-sensitive DRG neurons. A, Representative whole-cell recording in the voltage-clamp configuration (Vhold = −60 mV) of a TRPM8-expressing, cold-sensitive DRG neuron identified by the expression of EYFP. TAC (30 μm) evoked an inward current similar in amplitude to that elicited by menthol (30 μm). Both TAC and menthol strongly potentiate the response to cold. Bottom, Simultaneous recording of bath temperature during the recording. B, Current-temperature relationships for the same neuron in control (black trace) and in the presence of 30 μm TAC (red trace) or 30 μm menthol (green trace). Note the marked shift in temperature threshold. C, Bar histogram summarizing the effects of agonists on the amplitude of inward currents during the protocol shown in A. The statistical analysis consisted of a one-way ANOVA followed by Bonferroni's post hoc test (*p < 0.05, **p < 0.01). D, Representative recording of a cold-sensitive DRG neuron in the whole-cell current-clamp configuration showing responses to cold and to the application of TAC (30 μm). TAC evoked AP firing at 33°C and greatly enhanced the firing frequency during a cold ramp. Bottom, Simultaneous recording of bath temperature. E, Bar histogram summarizing the mean responses, measured as average firing frequency, during the different stimuli applied. Firing frequency for cold was averaged from the first to the last spike during the cooling ramp. Firing frequency in control condition was calculated during the minute preceding TAC application (only 3 of 7 neurons fired action potentials in control conditions). TAC-evoked firing was calculated from the first spike during TAC application to the start of the cold ramp. The analysis consisted of a paired t test for cold versus TAC plus cold (**p = 0.009) and control vs TAC (*p = 0.048).
Figure 11.
Figure 11.
TAC activates corneal cold thermoreceptor endings. A, Representative example of nerve terminal impulses recorded from a mouse corneal ending in control solution, at three different temperatures. B, Recordings from the same ending during application of 30 μm TAC. C, Instantaneous firing frequency from the same ending as in A (control solution), and D, as in B (in TAC). Note the regular firing in bursts during cooling. E, Summary of the effects of 30 μm TAC on spontaneous firing in 7 individual endings at the basal temperature of 34°C. The increase in firing was statistically significant (***p < 0.001, paired Student's t test). F, Mean firing rate in TAC at three different temperatures in 7 cold thermoreceptor endings. Activity at each temperature has been normalized to the value obtained in control solution. Statistical differences evaluated by one-way ANOVA for repeated measures followed by Bonferroni post hoc test. (*p < 0.05, ***p < 0.001.)
Figure 12.
Figure 12.
TAC activates cutaneous cold thermoreceptors. A, Representative recording showing the response of a cold fiber to a decrease in the temperature of the isolated receptive field, before and after treatment with 30 μm TAC. Top to bottom, Instantaneous firing frequency, the voltage signal, and the temperature of the receptive field. B, Histogram showing the averaged cold-evoked response of cold fibers from C57BL/6J mice in control solution (black triangles), in the presence of 30 μm TAC (orange circles), and in 50 μm menthol (green squares). Average discharge rates are represented in bins of 2 s. Bottom, The temperature ramp for each of the datasets. C, Temperature threshold for activation of impulse discharge. D, Temperature for reaching the maximal discharge rate. Squares represent mean values. Boxes represent SEM. Error bars indicate standard deviation (SD). In C and D, *p < 0.05, **p < 0.01, ***p < 0.001 (one-way ANOVA with Bonferroni's post hoc correction). The asterisks compare significance with respect to cold. The #(p < 0.05) compares significance with respect to wash.
Figure 13.
Figure 13.
TAC sensitizes cold-evoked responses and triggers eye blinking and tearing. A, Withdrawal latencies for hindpaws placed in contact with a cold metal plate set at 10°C. Individual and mean ± SEM values in WT (filled bars) mice for different conditions: naive mice, after the injection of vehicle, 1% menthol, and 1% TAC. Right, Open bars represent the same experiment in Trpm8 KO mice. Differences with respect to naive (*), to vehicle (#) (one-way ANOVA followed by Bonferroni's post hoc test). TAC reduces the withdrawal latency in WT mice compared with Trpm8 KO. &&p < 0.01 (unpaired Student's t test). B, Effects of different topical solutions on basal tearing in mice. The left and the right eye received 2 μl of saline, vehicle (8% ethanol, 2% Cremophor in saline) or TAC (1%). Tearing was estimated from the length of staining in the threads. The effect of TAC was significant with respect to saline (**p < 0.01) or vehicle (*p < 0.05) (n = 10 mice; one-way ANOVA). C, Three consecutive applications of saline were used as a control (n = 5 mice). No increment in tearing was observed in this case (one-way ANOVA). D, Effects of different topical solutions (5 μl) on eye blinking, monitored over a 2 min period, in WT mice (filled bars; n = 8). Compared with saline (*) and vehicle (#) (see above), 1% TAC and hyperosmotic (785 mOsm/kg) solution increased the number of blinks (***p < 0.001. ##p < 0.01). In Trpm8 KO mice (open bars; n = 17), TAC increased the number of blinks with respect to saline (***p < 0.001) or the TAC vehicle (###p < 0.001), and Hyp increased the blinks with respect to saline (**p < 0.001) (one-way ANOVA followed by Bonferroni's post hoc test). The number of blinks to Hyp were significantly reduced in Trpm8 KO mice compared with WT. &&p < 0.01 (unpaired Student's t test).

References

    1. Abud TB, Amparo F, Saboo US, Di Zazzo A, Dohlman TH, Ciolino JB, Hamrah P, Dana R (2016) A clinical trial comparing the safety and efficacy of topical tacrolimus versus methylprednisolone in ocular graft-versus-host disease. Ophthalmology 123:1449–1457. 10.1016/j.ophtha.2016.02.044 - DOI - PMC - PubMed
    1. Alamri AS, Wood RJ, Ivanusic JJ, Brock JA (2018) The neurochemistry and morphology of functionally identified corneal polymodal nociceptors and cold thermoreceptors. PLoS One 13:e0195108. 10.1371/journal.pone.0195108 - DOI - PMC - PubMed
    1. Alcalde I, Íñigo-Portugués A, González-González O, Almaraz L, Artime E, Morenilla-Palao C, Gallar J, Viana F, Merayo-Lloves J, Belmonte C (2018) Morphological and functional changes in TRPM8-expressing corneal cold thermoreceptor neurons during aging and their impact on tearing in mice. J Comp Neurol 526:1859–1874. 10.1002/cne.24454 - DOI - PubMed
    1. Almaraz L, Manenschijn JA, de la Peña E, Viana F (2014) Trpm8. Handb Exp Pharmacol 222:547–579. 10.1007/978-3-642-54215-2_22 - DOI - PubMed
    1. Andersen HH, Olsen RV, Møller HG, Eskelund PW, Gazerani P, Arendt-Nielsen L (2014) A review of topical high-concentration L-menthol as a translational model of cold allodynia and hyperalgesia. Eur J Pain 18:315–325. 10.1002/j.1532-2149.2013.00380.x - DOI - PubMed

Publication types

MeSH terms