. 2018 Dec 13;7(12):bio038968.
doi: 10.1242/bio.038968.

Dynamic microtubules drive fibroblast spreading

Affiliations

Dynamic microtubules drive fibroblast spreading

Anna Tvorogova et al. Biol Open. .

Abstract

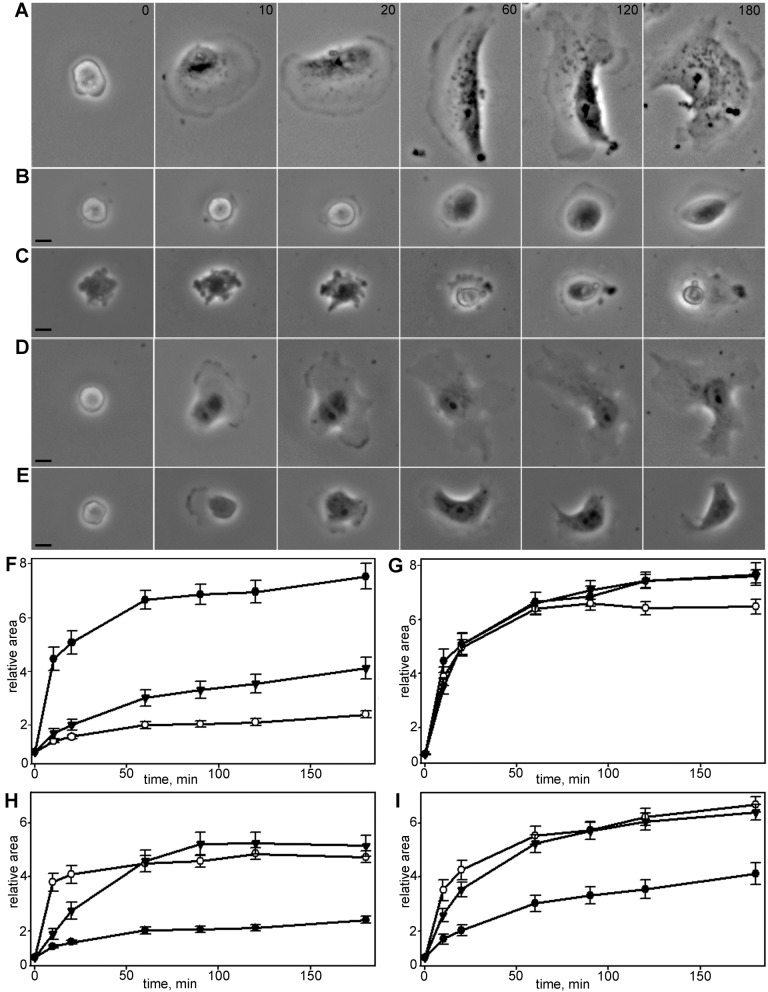
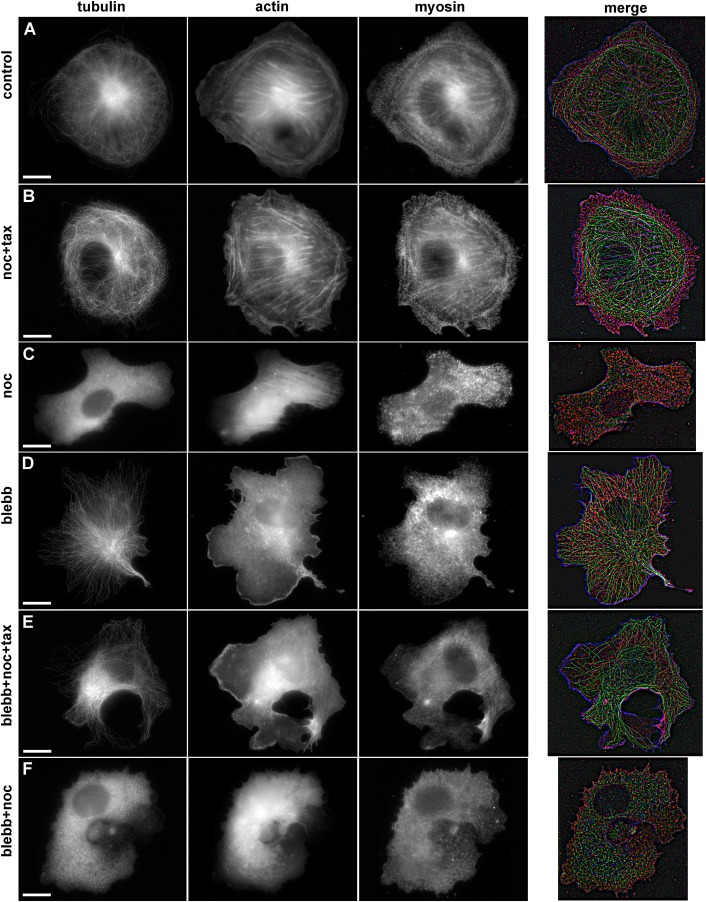
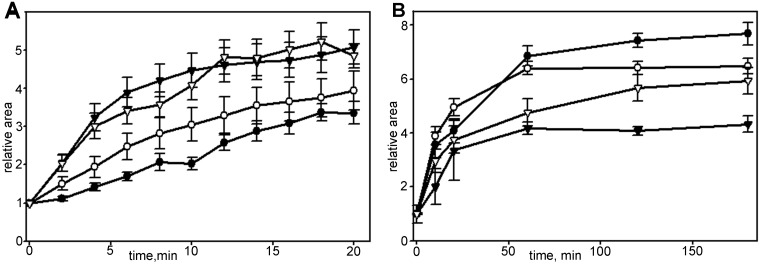
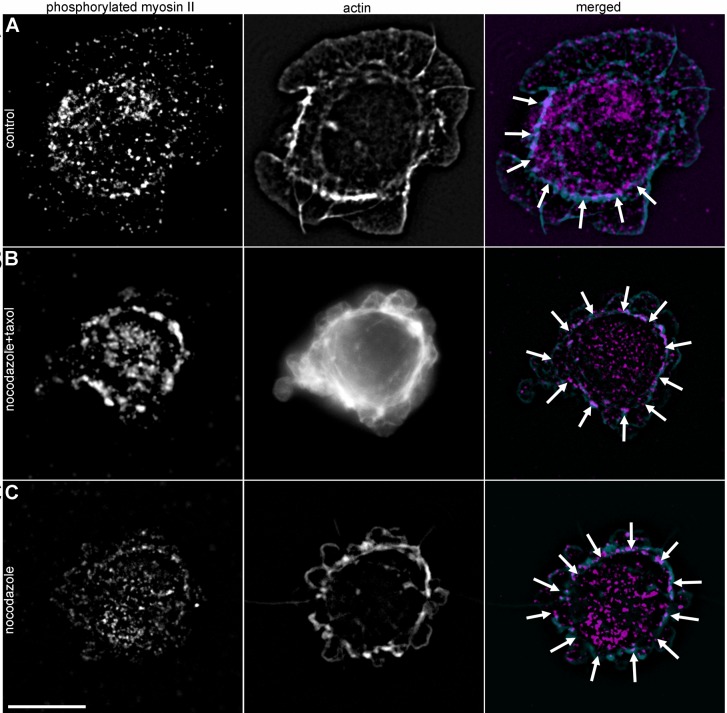
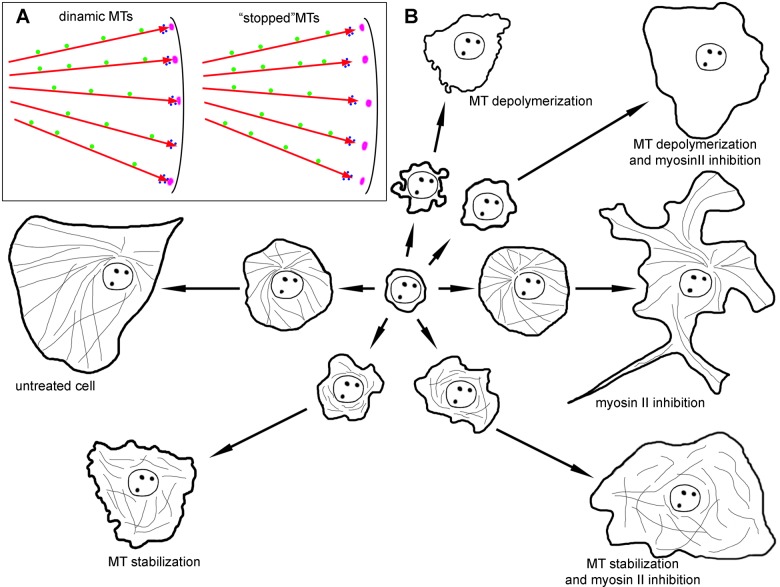
When cells with a mesenchymal type of motility come into contact with an adhesive substrate they adhere and start spreading by the formation of lamellipodia. Using a label-free approach and virtual synchronization approach we analyzed spreading in fibroblasts and cancer cells. In all cell lines spreading is a non-linear process undergoing isotropic or anisotropic modes with first fast (5-20 min) and then slow (30-120 min) phases. In the first 10 min cell area increases 2-4 times, while the absolute rate of initial spreading decreases 2-8 times. Fast spreading depends on actin polymerization and dynamic microtubules. Inhibition of microtubule growth was sufficient for a slowdown of initial spreading. Inhibition of myosin II in the presence of stable microtubules restored fast spreading. Inhibition of actin polymerization or complete depolymerization of microtubules slowed down fast spreading. However, in these cases inhibition of myosin II only partially restored spreading kinetics. We conclude that rapid growth of microtubules towards cell margins at the first stage of cell spreading temporarily inhibits phosphorylation of myosin II and is essential for the fast isotropic spreading. Comparison of the fibroblasts with cancer cells shows that fast spreading in different cell types shares similar kinetics and mechanisms, and strongly depends on dynamic microtubules.

Keywords: Cell spreading; Cytoskeleton; Microtubule dynamics; Myosin II.


Conflict of interest statement

Competing interestsThe authors declare no competing or financial interests.

Figures

Fig. 1.
Fig. 1.
Kinetics and morphology of cell spreading for different cell lines and substrates. (A) Relative area increase for Vero cells in first 20 min after plating. Cells with isotropic spreading (white circles) exhibit more distinct phase transition than anisotropically spread cells (black circles), black triangles represent a graph for whole population. (B) Vero cells spreading morphology on the glass. Scale bar: 10 µm. Cell with isotropic type of spreading extends smooth lamellae on the >2/3 of circumference, cell with anisotropic spreading extends two or more short lamellae with concave edges. (C) Kinetics of Vero (black triangles), MEF (white circles) and 3T3 (black circles) spreading on glass surface. Vero cells demonstrated most obvious transition between phases, although the type of kinetic curve was similar for all cell lines. (D) Spreading of Vero cells on the glass in presence of serum (white circles), on the poly-L-lysine covered glass in presence of serum (black circles), on the fibronectin-covered glass in presence of serum (black triangles) and on the fibronectin-covered glass in absence of serum (white triangles). In the absence of serum cell spreading on the fibronectin-covered surface is decelerated, but the transition between spreading phases and the type of kinetic curve remains the same. In the presence of both integrin-specific (fibronectin) and nonspecific (vitronectin) ligands spreading kinetics becomes more linear and after 180 min cells continue to spread without transition to polarization.
Fig. 2.
Fig. 2.
Vero cell spreading morphology. Time is indicated in min. Scale bars: 10 µm. (A) Spreading of untreated cell. (B) Spreading of a cell with stabilized MTs. Cells with stabilized MTs retain the general morphology of normal fibroblasts, although the spreading is mainly anisotropic. (C) Spreading of a cell with depolymerized MTs. Spreading is always anisotropic and substantially decelerated compared to normal fibroblasts. (D) Spreading of a cell with stabilized MTs treated with blebbistatin. Blebbistatin partially restores normal kinetics and morphology of fast spreading in cells with stabilized MTs, in later stages cell exhibits incurved edges, but blebbing disappears compared to cells with stabilized MTs only. (E) Spreading of a cell with depolymerized MTs treated with blebbistatin. Blebbistatin partially restores fast spreading and inhibits blebbing in cells with depolymerized MTs; however, the whole process is relatively slow. On late stages of spreading cell exhibit incurved edges. (F) Spreading of Vero cells in normal conditions (black circles), after stabilization of MTs (black triangles) and after complete depolymerization of MTs (white circles), for each set N=20, data presented as mean±s.e.m. Cells with compromised and stabilized MTs demonstrate lower rates of initial spreading rate and more linear kinetics of spreading process. (G) Spreading of Vero cells in normal conditions (black circles), in the presence of blebbistatin (black triangles) and in the presence of Y-27632 (white circles) for each set N=20, data presented as mean±s.e.m. Myosin II inhibitors do not accelerate early or late spreading. (H) Spreading of Vero cells with completely depolymerized MTs in the presence of myosin II inhibitors (black circles, nocodazole only; white circles blebbistatin and nocodazole; black triangles Y-27632 and nocodazole), for each set N=20, data presented as mean±s.e.m. Myosin II inhibitors partially restore fast spreading kinetics in cells with fully depolymerized MTs. I–Spreading of Vero cells with stabilized MTs in the presence of myosin II inhibitors (black circles–nocodazole and paclitaxel, white circles blebbistatin and nocodazole and paclitaxel, black triangles Y-27632 and nocodazole and paclitaxel), for each set N=20, data presented as mean±s.e.m. Myosin II inhibitors partially restore kinetics of fast spreading (first 10 min) in the cells with stabilized MTs.
Fig. 3.
Fig. 3.
The length of MT tracks in normal Vero cells and after MT stabilization with nocodazole and paclitaxel. Scale bars: 10 µm. (A) Maximum intensity projection of MT tracks visualized by EB3 protein in an untreated cell, (MIP of 15 frames, the time interval between frames is 2 s). MT tracks are organized into a radial array. (B) Maximum intensity projection of MT tracks visualized by EB3 protein in a cell with stabilized MTs, (MIP of 15 frames, the time interval between frames is 2 s) MT tracks are shortened compared to tracks in the untreated cell. (C) Maximum intensity projection of MT tracks visualized by EB3 protein in an untreated 3T3 cell, 20 min after initial attachment (MIP of 15 frames, the time interval between frames is 2 s). In the radially spreading cell, most plus ends grow into the nascent lamellae, the distance between MTs' plus ends and cell margin is short. (D) Maximum intensity projection of MT tracks visualized by EB3 protein in a 3T3 cell with stabilized MTs, 20 min after initial attachment (MIP of 15 frames, the time interval between frames is 2 s). Tracks of MTs' plus ends lose their radial organization, and the distance between MTs' plus ends and cell margin increases dramatically. (E) Length distribution of tracks in cells with normal and stabilized MTs. MT tracks are shorter in cells with stabilized MTs (gray bars) compared to untreated cells (black bars).
Fig. 4.
Fig. 4.
Effects of EB3 depletion in Vero cells. (A) Life histories of single MTs in 3T3 cells transfected with alpha-tubulin, MTs in untreated cells demonstrate dynamic instability. (B) Life histories of MTs in 3T3 cells, expressing shEB3 and transfected with alpha-tubulin. In EB3-depleted cells dynamic instability of MTs was suppressed. (C–D) Immunofluorescent staining with EB3 antibodies, in EB3-depleted cells (D) comets are almost absent compared to control cells (C). (E) Spreading of Vero cells in normal conditions (white circles), in EB3-depleted cells (black circles) and in cells with stabilized MTs (black triangles). (F) Spreading of EB3-depleted cell is mainly anisotropic, the cell fails to form a large lamellum and spreads through formation of short lamellipodia. Scale bars: 10 µm.
Fig. 5.
Fig. 5.
Immunofluorescent staining of α-tubulin, actin, and myosin IIa in spreading Vero cells in normal conditions and after treatment with inhibitors. Scale bars: 10 µm. (A) Untreated cell, long MTs form a radial array, with a short distance between their ends and cell margin. Stress fibers are located in the cell body, and diffuse actin staining can be observed in lamellum, myosin II molecules demonstrate periodic banding of actin bundles. (B) Cell with stabilized MTs. MTs are randomly distributed, often buckled, the distance between cell margin and MTs' plus ends is twice more compared to control cells. Long actin fibers stretch across the cell body and small thin actin bundles are present in the lamellum; myosin II demonstrate periodic banding of actin bundles. (C) Cell with depolymerized MTs, tubulin staining is diffuse, thick actin fibers across the cell body, lamellum disappears, myosin II molecules demonstrate periodic banding of actin bundles. (D) Cell treated with blebbistatin. MT array is organized similarly to the control cells, short and thin actin bundles are located in the cell body, myosin is located diffusely in cytoplasm. (E) Cell with stabilized MTs additionally treated with blebbistatin. Randomly distributed MTs do not enter into lamellum, residual short actin bundles are located in the cell body, myosin II is diffusely distributed throughout the cytoplasm. (F) Cell with depolymerized MTs additionally treated with blebbistatin. Residual thin actin bundles are located in the cell body, myosin II is diffusely distributed throughout the cytoplasm.
Fig. 6.
Fig. 6.
Changes in spreading kinetics of Vero cells in the presence of cytochalasin D. For each set N=20, data presented as mean±s.e.m. (A) Spreading in first 20 min in control (black triangles), blebbistatin-treated (white triangles), cytochalasin D-treated (black circles) and cells under simultaneous addition of cytochalasin D and blebbistatin (white circles). (B) Spreading in first 180 min in control (black circles), treated with blebbistatin (white circles), treated with cytochalasin D (black triangles) and cells under simultaneous treatment with cytochalasin D and blebbistatin (white triangles). Myosin relaxation facilitates overall spreading process.
Fig. 7.
Fig. 7.
Myosin II phosphorylation during 5 min after initial attachment. Scale bar: 10 µm. (A) Untreated cell, phosphorylated myosin II is scattered within the cytoplasm and seen as small dots on actin fibers. (B) Cell with stabilized MTs, prominent actin bundles and a bright ring of phosphorylated myosin II (indicated by white arrows) is located near the cell margin. (C) Cell with depolymerized MTs. Actin bundles form a ring near the cell margin and are colocalized with phosphorylated myosin II (white arrows).
Fig. 8.
Fig. 8.
Schematic representation of the role of dynamic MTs and myosin relaxation in cell spreading. (A) MTs (red arrows) are responsible for the delivery of signals that are transported along MTs towards the cell edge (green circles), while other factors are delivered directly by growing MT tips along with plus end comet (blue circles). Nascent focal adhesions are in purple. MTs stopped by nocodazole and taxol treatment do not reach focal adhesions with their plus-end comets. (B) Untreated cell forms a large lamellum during fast spreading module and transfers to polarization during slow spreading. A cell with depolymerized MTs loses fast spreading module and demonstrate continuous blebbing. When MTs are stabilized, kinetics remains the same as for depolymerized MTs, but blebbing almost disappears. The inhibition of myosin II does not affect the fast spreading module, but heavily alters cell morphology during slow spreading module. Additional treatment of cell with compromised MTs with myosin II pathway inhibitors partially restores kinetics of fast spreading.

Similar articles

Cited by

References

    1. Anastasiadis P. Z., Moon S. Y., Thoreson M. A., Mariner D. J., Crawford H. C., Zheng Y. and Reynolds A. B. (2000). Inhibition of RhoA by p120 catenin. Nat. Cell Biol. 2, 637-644. 10.1038/35023588 - DOI - PubMed
    1. Bardsley W. G. and Aplin J. D. (1983). Kinetic analysis of cell spreading. I. Theory and modelling of curves. J. Cell Sci. 61, 365-373. - PubMed
    1. Bereiter-Hahn J., Luck M., Miebach T., Stelzer H. K. and Voth M. (1990). Spreading of trypsinized cells: cytoskeletal dynamics and energy requirements. J. Cell Sci. 96, 171-188. - PubMed
    1. Bergert M., Chandradoss S. D., Desai R. A. and Paluch E. (2012). Cell mechanics control rapid transitions between blebs and lamellipodia during migration. Proc. Natl. Acad. Sci. USA 109, 14434-14439. 10.1073/pnas.1207968109 - DOI - PMC - PubMed
    1. Bershadsky A. D., Balaban N. Q. and Geiger B. (2003). Adhesion-dependent cell mechanosensitivity. Annu. Rev. Cell Dev. Biol. 19, 677-695. 10.1146/annurev.cellbio.19.111301.153011 - DOI - PubMed