Clinical Trial
. 2018 Dec 13;8(1):17812.
doi: 10.1038/s41598-018-36129-1.

Analysis of expression of the PD-1/PD-L1 immune checkpoint system and its prognostic impact in gastroenteropancreatic neuroendocrine tumors

Affiliations
Clinical Trial

Analysis of expression of the PD-1/PD-L1 immune checkpoint system and its prognostic impact in gastroenteropancreatic neuroendocrine tumors

Miguel Sampedro-Núñez et al. Sci Rep. .

Abstract

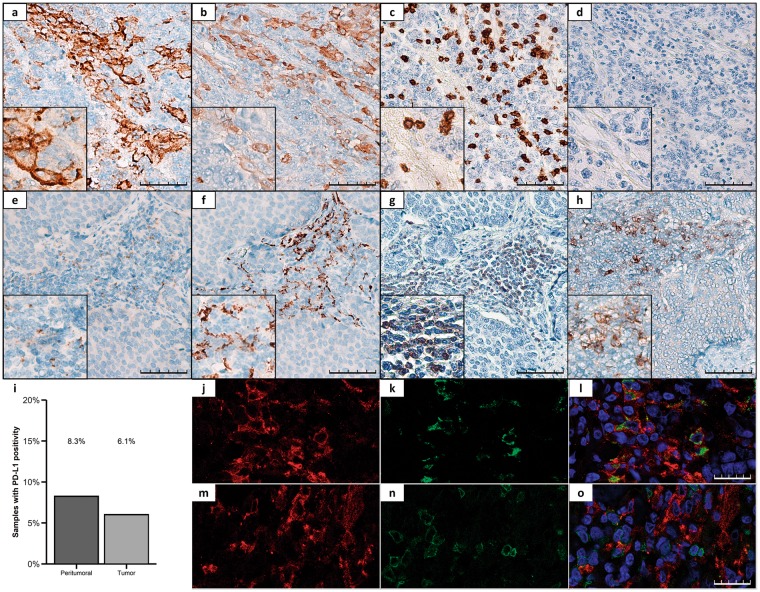
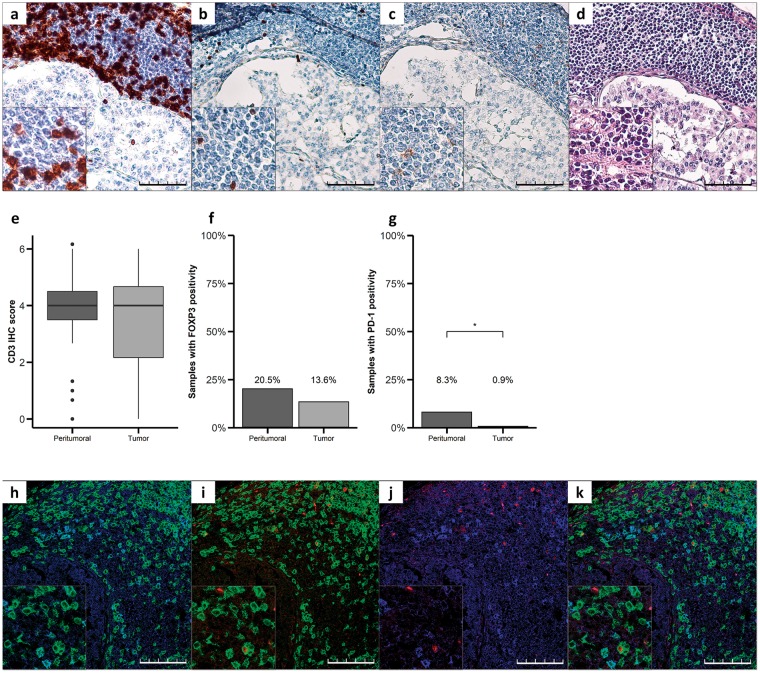
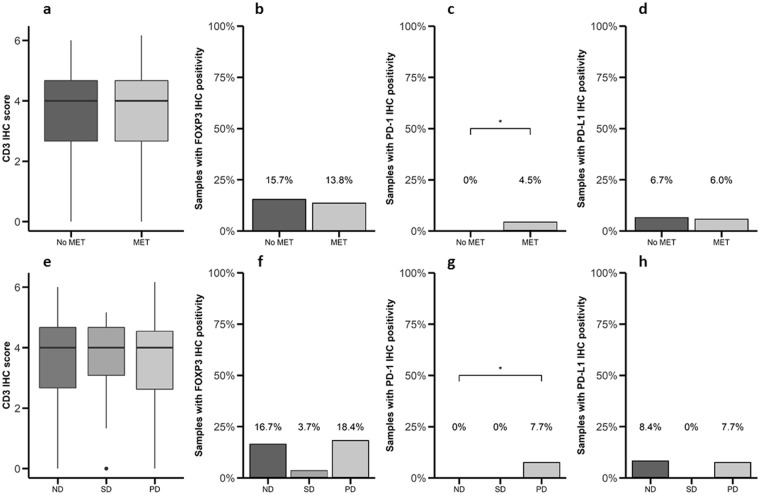
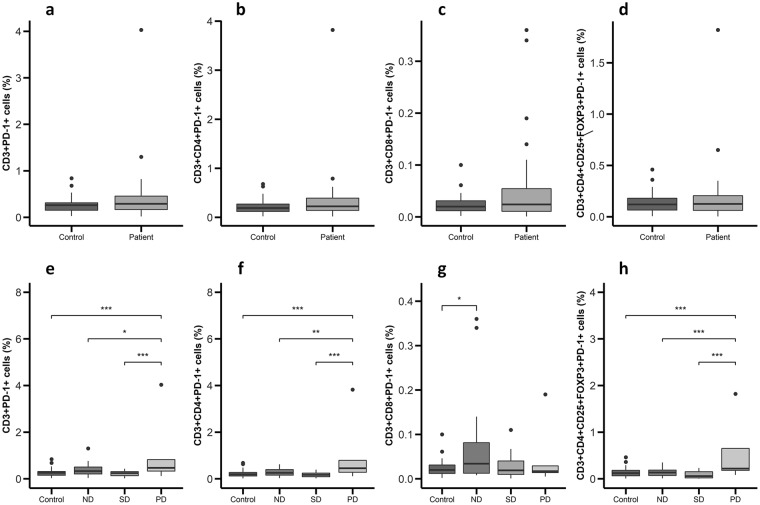
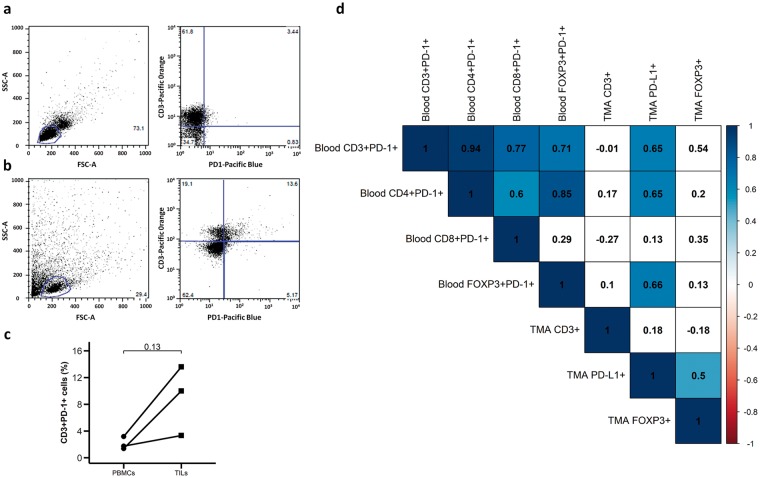
The immune checkpoint based therapy targeting the programmed death-1 (PD-1) receptor and its PD-L1 ligand has recently been approved for the therapy of different malignant conditions, but not yet for gastroenteropancreatic neuroendocrine tumors (GEP-NETs). In this context, we evaluated the expression of PD-1 and PD-L1 in GEP-NETs and its potential correlations with clinical outcomes. Expression of PD-1/PD-L1 was analyzed by immunohistochemistry in 116 GEP-NETs and 48 samples of peritumoral tissue. In addition, the expression of these molecules was assessed by flow cytometry in peripheral blood mononuclear cells (PBMC) from patients with GEP-NETs (n = 32) and healthy controls (n = 32) and in intratumoral mononuclear cells (TMCs) (n = 3). Expression of PD-L1 and PD-1 was detected by immunohistochemistry in 6% and 1% of tumor tissue samples, respectively, and in 8% of peritumoral tissue samples, for both markers. We also observed that PD-1 expression by TMCs was associated with metastatic disease at diagnosis, and the levels of circulating PD-1+ PBMCs were associated with progressive disease upon follow-ups. In addition, circulating PD-1+ PBMCs were significantly correlated with PD-L1 expression by tumor cells. Our data suggest that PD-1/PD-L1 is expressed in 1 to 8% of GEP-NETs, and that this feature is significantly associated with disease evolution (p < 0.01).


Conflict of interest statement

M.M. and M.S.N. has received speaker’s fees from Novartis and Ipsen. The rest of the authors have nothing to disclose.

Figures

Figure 1
Figure 1
Representative immunohistochemical staining patterns of PD-L1 in GEP-NETs. (ad) TMA sections of a G3 pancreatic NET. (a) Positive membranous staining for PD-L1 in cancer cells. (b) CD163 expression in peritumoral macrophages. (c) CD3 expression in peritumoral lymphocytes. (d) Negative expression of PD-1. (eh) TMA sections of a G2 intestinal NET. (e) Positive membranous staining for PD-L1 in peritumoral infiltrating cells. (f) CD163 expression in peritumoral macrophages. (g) CD3 expression in peritumoral lymphocytes. (h) Positive expression of PD-1. Original magnification with 20x and 40x (insets). Scale bar for 100 µm is represented with a line for each panel. (i) PD-L1 expression was measured by IHC in a set of TMAs (n = 164) of GEP-NETs. Bar graph values represent the percentage of samples with positivity for PD-L1 expression in the peritumoral and in tumoral tissue. (jo) Immunofluorescence (IF) staining in a G3 intestinal NET. (j,m) Simple IF with PD-L1 (red). (k) Simple IF with CD68 (green). (l) Double IF with CD68 (green) and PD-L1 (red). (n) Simple IF with CD3 (green). (o) Double IF with CD3 (green) and PD-L1 (red). Scale bar for 25 µm is represented with a line for each panel.
Figure 2
Figure 2
Characterization of the immune cell infiltrate in GEP-NETs. (ad) Serial sections of a pancreatic neuroendocrine tumor. (a) Intense staining for CD3 in TILs of NET tissue. (b) Staining for FOXP3 in some TILs. (c) Staining for PD-1 in some TILs, (d) hematoxylin-eosin staining. Original magnification with 20x and 40x (insets). Scale bar for 100 µm is represented with a line for each panel. (e) CD3, (f) FOXP3 and (g) PD-1 were measured by IHC in a set of TMAs (n = 164) of GEP-NETs, including primary and metastatic tissue. Values represent boxplot of CD3 IHC score and bar graphs of the percentage of samples with positivity for FOXP3 and PD-1 expression in the tumor tissue and in the peritumoral normal tissue. Asterisks indicate significant differences between tumor and peritumoral tissues (p-values for Fisher’s Exact Test: *p < 0.05). (hk) Immunofluorescence showing different markers in TILs: h) Double immunofluorescence with CD3 (green) and PD-1 (blue). (i) Double immunofluorescence with CD3 (green) and FOXP3 (red). (j) Double immunofluorescence with PD-1 (blue) and FOXP3 (red). (k) Triple immunofluorescence with CD3 (green), PD-1 (blue) and FOXP3 (red). Scale bar for 100 µm is represented with a line for each panel.
Figure 3
Figure 3
Expression of PD-1 is associated to increased malignancy in patients with GEP-NETs. (a,e) CD3, (b,f) FOXP3, (c,g) PD-1 and (d,h) PD-L1 were measured by IHC in a set of TMAs (n = 164) of GEP-NETs. Values represent boxplot of CD3 IHC score and bar graphs of the percentage of samples with positivity for PD-1, FOXP3 and PD-L1 expression. (ad) Samples were classified based on metastases status at diagnosis: patients with metastasis (MET) or without metastasis (No MET). (eh) Samples were classified based on the disease status at follow-up evaluation: (1) non-residual disease, if a complete resection after surgery had been achieved and no tumor relapse/recurrence was evidenced; (2) stable disease, in cases of residual but non-progressive tumor burden; and (3) progressive disease, if tumor growth or new lesions were detected. The median of follow-up was 4.9 years (p25: 2.6–p75: 8.6 years). Asterisks indicate significant differences (p-value for Fisher’s Exact Test: *p < 0.05).
Figure 4
Figure 4
PD-1+ lymphocytes are increased in PBMCs from GEP-NET patients with progressive disease. PBMCs from 32 patients and 32 controls were isolated and incubated with conjugated antibodies directed against CD3, CD4, CD8, CD25, FOXP3 and PD-1. Measurements were made by flow cytometry as stated in ‘Materials and Methods’ and values represent percentage of positive cells for each marker depicted as boxplots. (ad) Percentage of PD-1+ cells in healthy controls and patients. (eh) Percentage of PD-1+ cells in controls and patients classified according to disease status in non-residual disease (ND), stable disease (SD) or progressive disease (PD). Asterisks indicate significant differences (p-values for Tukey’s test: *p < 0.05, **p < 0.01, ***p < 0.001).
Figure 5
Figure 5
Simultaneous analysis of peripheral blood and tumor samples. Dot plots of CD3+PD-1+ cells from (a) peripheral blood and (b) tumor specimen from a representative GEP-NET patient. (c) Paired analysis of expression of CD3 + PD-1+ cells in PBMCs and TILs from 3 patients with GEP-NETs. Values represent percentage of CD3 + PD-1+ cells in PBMCs and TILs. P-value from paired T test is shown. (d) Correlation map for the expression of immune markers in TMAs (IHC) and PBMCs (flow cytometry). Values represent the Spearman’s rank correlation coefficient, rho (ρ). Significant negative correlations are shown in orange and significant positive correlations in blue. Color intensity increases with the magnitude of correlation. White color indicates a non-significant correlation.

References

    1. Gajewski TF, Schreiber H, Fu YX. Innate and adaptive immune cells in the tumor microenvironment. Nat Immunol. 2013;14:1014–1022. doi: 10.1038/ni.2703. - DOI - PMC - PubMed
    1. Buchbinder EI, Desai A. CTLA-4 and PD-1 Pathways: Similarities, Differences, and Implications of Their Inhibition. Am J Clin Oncol. 2016;39:98–106. doi: 10.1097/COC.0000000000000239. - DOI - PMC - PubMed
    1. Parry RV, et al. CTLA-4 and PD-1 receptors inhibit T-cell activation by distinct mechanisms. Mol Cell Biol. 2005;25:9543–9553. doi: 10.1128/MCB.25.21.9543-9553.2005. - DOI - PMC - PubMed
    1. Topalian SL, Drake CG, Pardoll DM. Immune checkpoint blockade: a common denominator approach to cancer therapy. Cancer Cell. 2015;27:450–461. doi: 10.1016/j.ccell.2015.03.001. - DOI - PMC - PubMed
    1. Brahmer JR, et al. Phase I study of single-agent anti-programmed death-1 (MDX-1106) in refractory solid tumors: safety, clinical activity, pharmacodynamics, and immunologic correlates. J Clin Oncol. 2010;28:3167–3175. doi: 10.1200/JCO.2009.26.7609. - DOI - PMC - PubMed

Publication types

MeSH terms

Supplementary concepts