

GIT1 contributes to autophagy in osteoclast through disruption of the binding of Beclin1 and Bcl2 under starvation condition
- PMID: 30546041
- PMCID: PMC6294144
- DOI: 10.1038/s41419-018-1256-8
GIT1 contributes to autophagy in osteoclast through disruption of the binding of Beclin1 and Bcl2 under starvation condition
Abstract
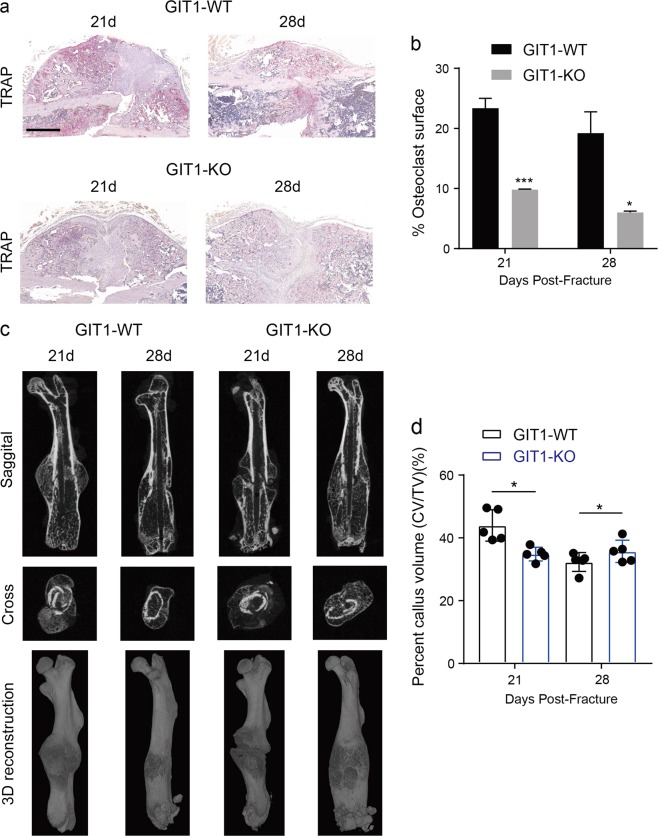
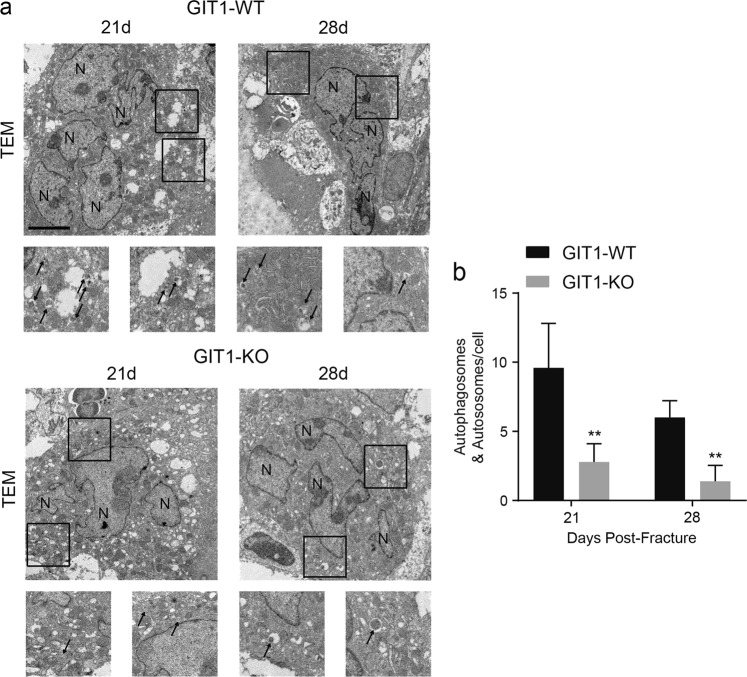
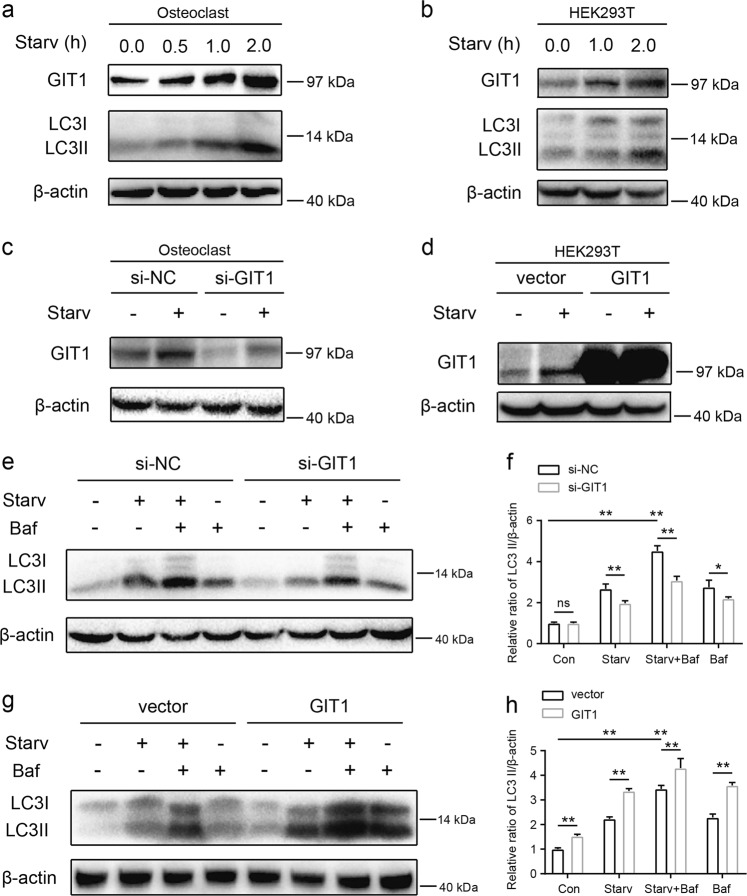
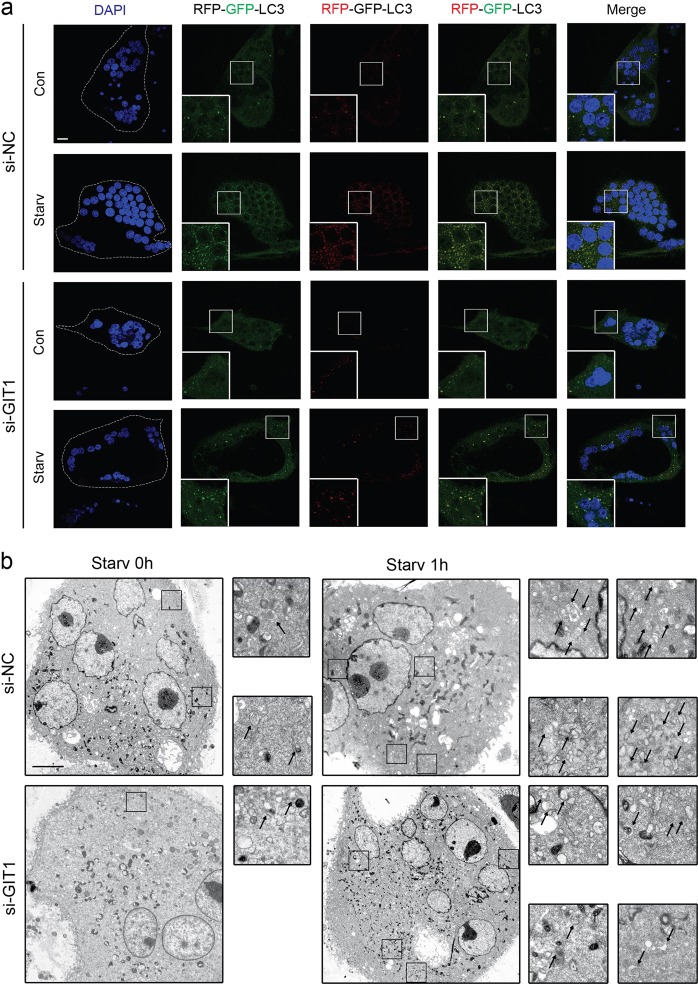
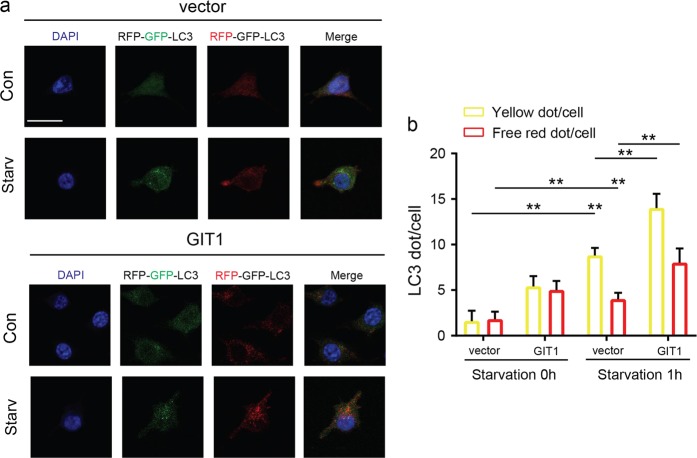
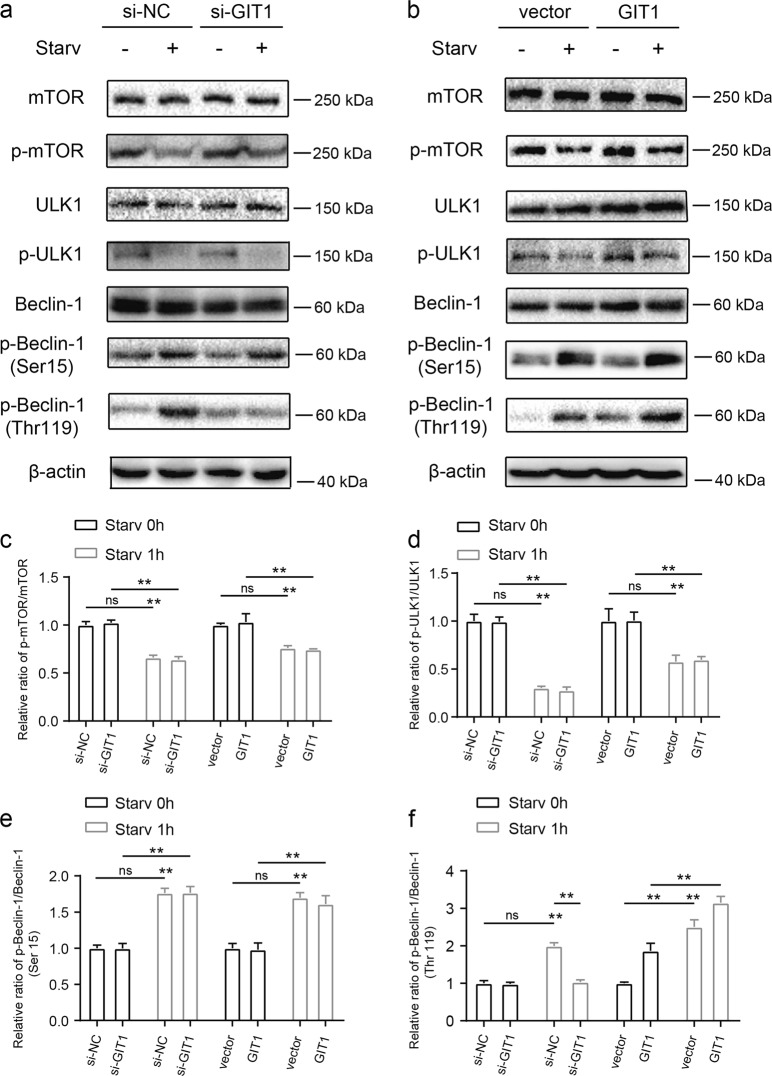
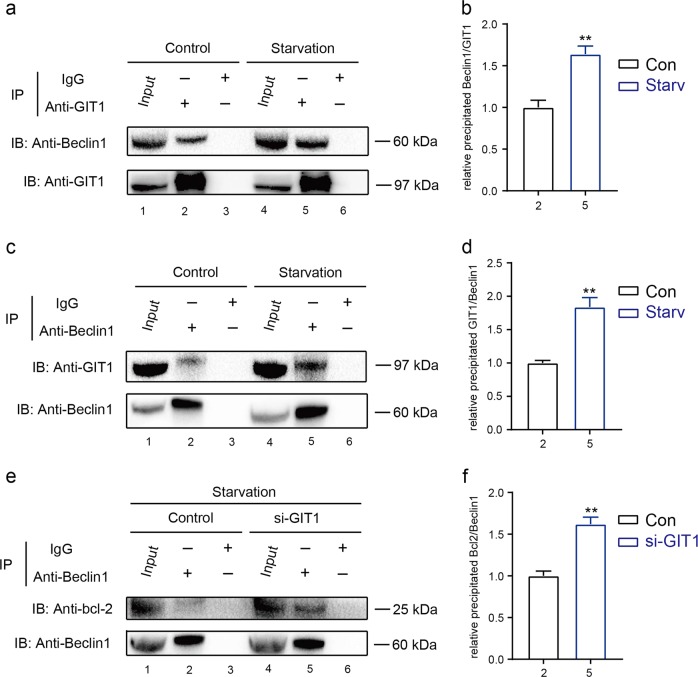
Approximately 10-15% of all bone fractures do not heal properly, causing patient morbidity and additional medical care expenses. Therefore, better mechanism-based fracture repair approaches are needed. In this study, a reduced number of osteoclasts (OCs) and autophagosomes/autolysosomes in OC can be observed in GPCR kinase 2-interacting protein 1 (GIT1) knockout (KO) mice on days 21 and 28 post-fracture, compared with GIT1 wild-type (GIT1 WT) mice. Furthermore, in vitro experiments revealed that GIT1 contributes to OC autophagy under starvation conditions. Mechanistically, GIT1 interacted with Beclin1 and promoted Beclin1 phosphorylation at Thr119, which induced the disruption of Beclin1 and Bcl2 binding under starvation conditions, thereby, positively regulating autophagy. Taken together, the findings suggest a previously unappreciated role of GIT1 in autophagy of OCs during fracture repair. Targeting GIT1 may be a potential therapeutic approach for bone fractures.
Conflict of interest statement
The authors declare that they have no conflict of interest.
Figures
Similar articles
-
GPCR kinase 2 interacting protein 1 (GIT1) regulates osteoclast function and bone mass.J Cell Physiol. 2010 Nov;225(3):777-85. doi: 10.1002/jcp.22282. J Cell Physiol. 2010. PMID: 20568227 Free PMC article.
-
Impaired angiogenesis during fracture healing in GPCR kinase 2 interacting protein-1 (GIT1) knock out mice.PLoS One. 2014 Feb 19;9(2):e89127. doi: 10.1371/journal.pone.0089127. eCollection 2014. PLoS One. 2014. PMID: 24586541 Free PMC article.
-
The protective effort of GPCR kinase 2-interacting protein-1 in neurons via promoting Beclin1-Parkin induced mitophagy at the early stage of spinal cord ischemia-reperfusion injury.FASEB J. 2020 Feb;34(2):2055-2074. doi: 10.1096/fj.201902047R. Epub 2019 Dec 27. FASEB J. 2020. PMID: 31908016
-
GIT1 is critical for formation of the CD31hiEmcnhi vessel subtype in coupling osteogenesis with angiogenesis via modulating preosteoclasts secretion of PDGF-BB.Bone. 2019 May;122:218-230. doi: 10.1016/j.bone.2019.03.006. Epub 2019 Mar 7. Bone. 2019. PMID: 30853660
-
IL-17A inhibits the degradation of RANKL in osteoblasts by inhibiting BCL2-Beclin1-autophagy signaling.In Vitro Cell Dev Biol Anim. 2023 Apr;59(4):300-311. doi: 10.1007/s11626-023-00761-7. Epub 2023 Mar 31. In Vitro Cell Dev Biol Anim. 2023. PMID: 37002492
Cited by
-
The role of autophagy in bone metabolism and clinical significance.Autophagy. 2023 Sep;19(9):2409-2427. doi: 10.1080/15548627.2023.2186112. Epub 2023 Mar 8. Autophagy. 2023. PMID: 36858962 Free PMC article.
-
Administration of necrostatin-1 ameliorates glucocorticoid-induced osteonecrosis of the femoral head in rats.J Mol Histol. 2023 Jun;54(3):207-216. doi: 10.1007/s10735-023-10124-x. Epub 2023 May 9. J Mol Histol. 2023. PMID: 37156987
-
Macrophage MSR1 promotes BMSC osteogenic differentiation and M2-like polarization by activating PI3K/AKT/GSK3β/β-catenin pathway.Theranostics. 2020 Jan 1;10(1):17-35. doi: 10.7150/thno.36930. eCollection 2020. Theranostics. 2020. PMID: 31903103 Free PMC article.
-
Macrophage GIT1 Contributes to Bone Regeneration by Regulating Inflammatory Responses in an ERK/NRF2-Dependent Way.J Bone Miner Res. 2020 Oct;35(10):2015-2031. doi: 10.1002/jbmr.4099. Epub 2020 Jul 9. J Bone Miner Res. 2020. PMID: 32460388 Free PMC article.
-
High Concentrations of Cannabidiol Induce Neurotoxicity in Neurosphere Culture System.Neurotox Res. 2024 Feb 13;42(1):14. doi: 10.1007/s12640-024-00692-5. Neurotox Res. 2024. PMID: 38349488
References
Publication types
MeSH terms
Substances
LinkOut - more resources
Full Text Sources
Research Materials
