

Quantitative Model for Ion Transport and Cytoplasm Conductivity of Chinese Hamster Ovary Cells
- PMID: 30546044
- PMCID: PMC6292909
- DOI: 10.1038/s41598-018-36127-3
Quantitative Model for Ion Transport and Cytoplasm Conductivity of Chinese Hamster Ovary Cells
Abstract
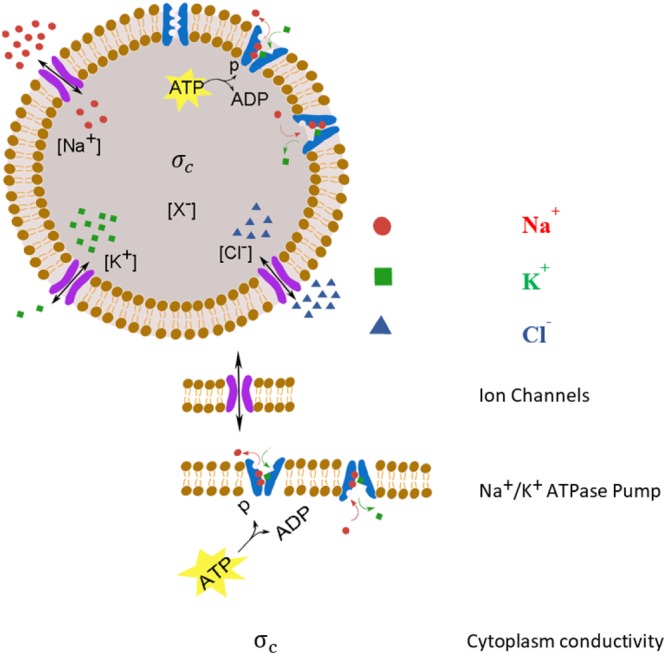
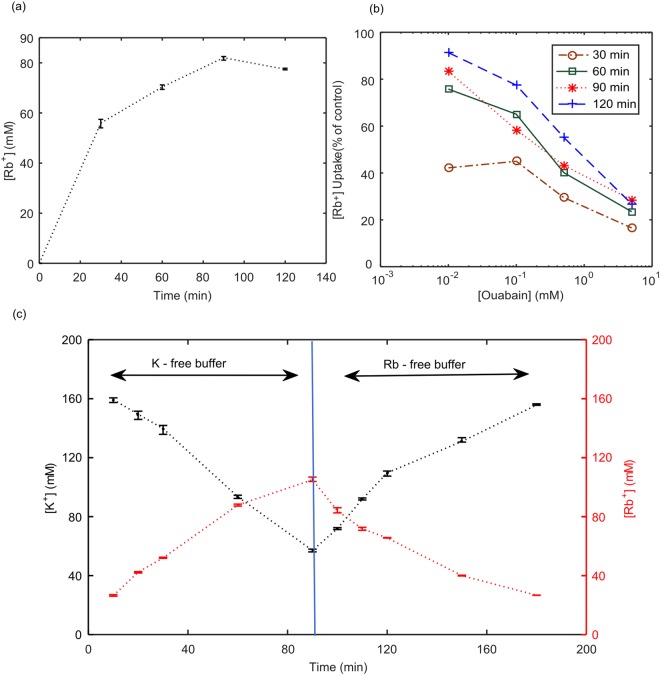
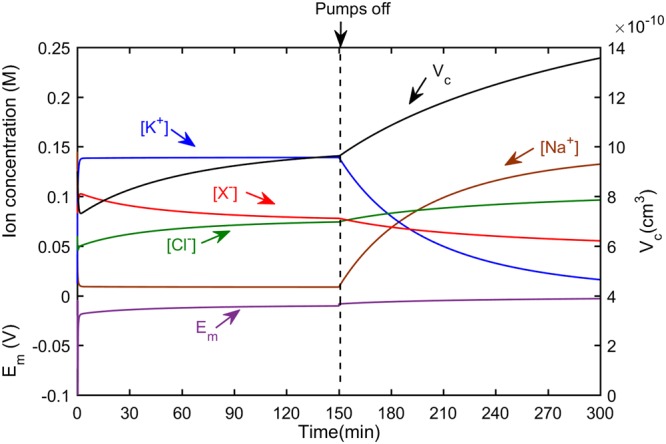
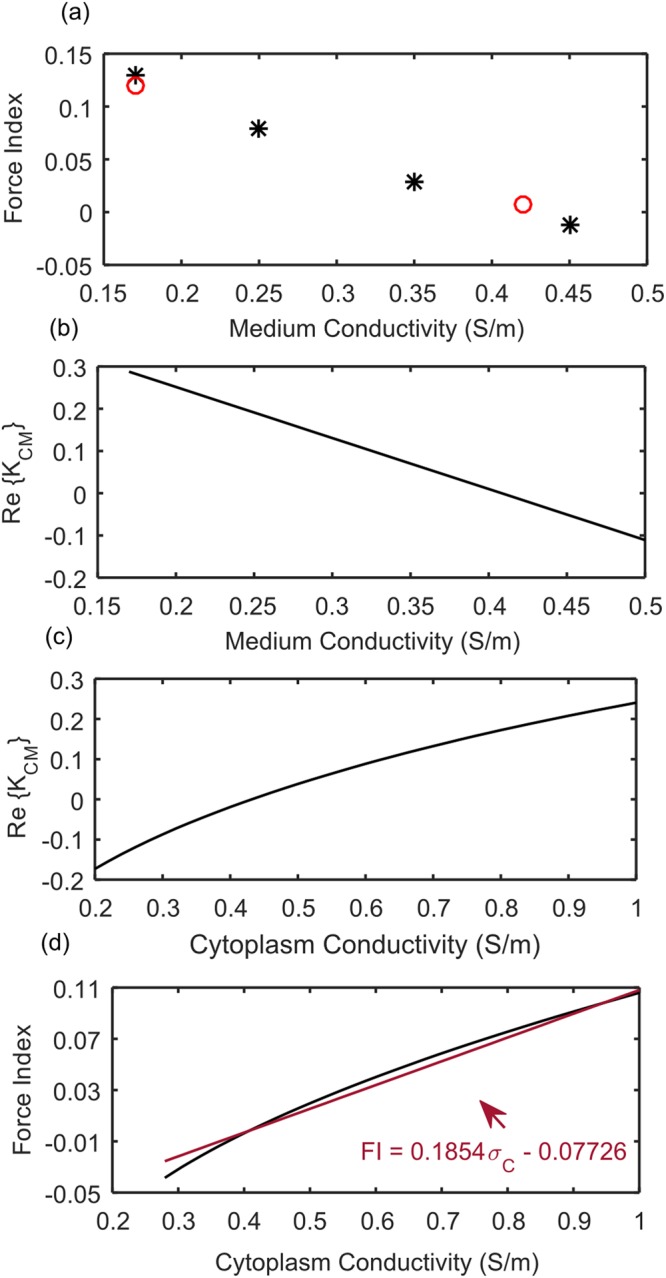
In mammalian cells cytoplasm ion concentrations and hence cytoplasm conductivity is an important indicator of their physiological state. Changes in the cytoplasm conductivity has been associated with physiological changes such as progression of cancer and apoptosis. In this work, a model that predicts the effects of physiological changes in ion transport on the cytoplasm conductivity of Chinese hamster ovary (CHO) cells is demonstrated. We determined CHO-specific model parameters, Na+/K+ ATPase pumps and ion channels densities, using a flux assay approach. The obtained sodium (PNa), potassium (PK) and chloride (PCl) permeability and Na+/K+ ATPase pump density were estimated to be 5.6 × 10⁻⁸ cm/s, 5.6 × 10⁻⁸ cm/s, 3.2 × 10⁻⁷ cm/s and 2.56 × 10⁻¹¹ mol/cm2, respectively. The model was tested by comparing the model predictions with the experimentally determined temporal changes in the cytoplasm conductivity of Na+/K+ ATPase pump inhibited CHO cells. Cells' Na+/K+ ATPase pumps were inhibited using 5 mM Ouabain and the temporal behavior of their cytoplasm conductivity was measured using dielectrophoresis cytometry. The measured results are in close agreement with the model-calculated values. This model will provide insight on the effects of processes such as apoptosis or external media ion concentration on the cytoplasm conductivity of mammalian cells.
Conflict of interest statement
The authors declare no competing interests.
Figures


Similar articles
-
Cytoplasmic conductivity as a marker for bioprocess monitoring: Study of Chinese hamster ovary cells under nutrient deprivation and reintroduction.Biotechnol Bioeng. 2019 Nov;116(11):2896-2905. doi: 10.1002/bit.27115. Epub 2019 Jul 23. Biotechnol Bioeng. 2019. PMID: 31286489
-
Overexpression of Na(+)/K (+)-ATPase parallels the increase in sodium transport and potassium recycling in an in vitro model of proximal tubule cellular ageing.J Membr Biol. 2006;212(3):163-75. doi: 10.1007/s00232-005-7017-5. Epub 2007 Feb 28. J Membr Biol. 2006. PMID: 17334838
-
The C-terminal tail of the polycystin-1 protein interacts with the Na,K-ATPase alpha-subunit.Mol Biol Cell. 2005 Nov;16(11):5087-93. doi: 10.1091/mbc.e05-03-0200. Epub 2005 Aug 17. Mol Biol Cell. 2005. PMID: 16107561 Free PMC article.
-
The Na,K-ATPase receptor complex: its organization and membership.Cell Biochem Biophys. 2006;46(3):303-16. doi: 10.1385/cbb:46:3:303. Cell Biochem Biophys. 2006. PMID: 17272855 Review.
-
Electrogenic ion transport by Na+,K+-ATPase.Membr Cell Biol. 2000;13(6):745-88. Membr Cell Biol. 2000. PMID: 10963433 Review.
Cited by
-
Long noncoding RNA network for lncRNA-mRNA interactions throughout swine estrous cycle reveals developmental and hormonal regulations in reproductive tissues.J Anim Sci Technol. 2024 Nov;66(6):1109-1126. doi: 10.5187/jast.2023.e137. Epub 2024 Nov 30. J Anim Sci Technol. 2024. PMID: 39691614 Free PMC article.
-
Nucleus size and its effect on nucleosome stability in living cells.Biophys J. 2022 Nov 1;121(21):4189-4204. doi: 10.1016/j.bpj.2022.09.019. Epub 2022 Sep 21. Biophys J. 2022. PMID: 36146936 Free PMC article.
-
Cell Volume Changes and Membrane Ruptures Induced by Hypotonic Electrolyte and Sugar Solutions.Front Physiol. 2020 Dec 7;11:582781. doi: 10.3389/fphys.2020.582781. eCollection 2020. Front Physiol. 2020. PMID: 33364974 Free PMC article.
-
Light-Emitting Diode Array with Optical Linear Detector Enables High-Throughput Differential Single-Cell Dielectrophoretic Analysis.Sensors (Basel). 2024 Dec 18;24(24):8071. doi: 10.3390/s24248071. Sensors (Basel). 2024. PMID: 39771806 Free PMC article.
-
Integrated Microfluidics for Single-Cell Separation and On-Chip Analysis: Novel Applications and Recent Advances.Small Sci. 2024 Feb 2;4(4):2300206. doi: 10.1002/smsc.202300206. eCollection 2024 Apr. Small Sci. 2024. PMID: 40212991 Free PMC article.
References
-
- Jayapal K, Wlaschin K, Hu W, Yap G. Recombinant protein therapeutics from CHO cells-20 years and counting. Chem. Eng. Prog. 2007;103:40–47.
Publication types
MeSH terms
Substances
LinkOut - more resources
Full Text Sources
Molecular Biology Databases
