Noninvasive evaluation of 18F-FDG/18F-FMISO-based Micro PET in monitoring hepatic metastasis of colorectal cancer
- PMID: 30546057
- PMCID: PMC6292879
- DOI: 10.1038/s41598-018-36238-x
Noninvasive evaluation of 18F-FDG/18F-FMISO-based Micro PET in monitoring hepatic metastasis of colorectal cancer
Abstract
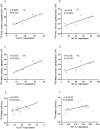
This study aimed to explore the application of two radiotracers (18F-fluorodeoxyglucose (FDG) and 18F-fluoromisonidazole (FMISO)) in monitoring hepatic metastases of human colorectal cancer (CRC). Mouse models of CRC hepatic metastases were established by implantation of the human CRC cell lines LoVo and HT29 by intrasplenic injection. Wound healing and Transwell assays were performed to examine cell migration and invasion abilities. Radiotracer-based cellular uptake in vitro and micro-positron emission tomography imaging of liver metastases in vivo were performed. The incidence of liver metastases in LoVo-xenografted mice was significantly higher than that in HT29-xenografted ones. The SUVmax/mean values of 18F-FMISO, but not 18F-FDG, in LoVo xenografts were significantly greater than in HT29 xenografts. In vitro, LoVo cells exhibited stronger metastatic potential and higher radiotracer uptake than HT29 cells. Mechanistically, the expression of HIF-1α and GLUT-1 in LoVo cells and LoVo tumor tissues was remarkably higher than in HT29 cells and tissues. Linear regression analysis demonstrated correlations between cellular 18F-FDG/18F-FMISO uptake and HIF-1α/GLUT-1 expression in vitro, as well as between 18F-FMISO SUVmax and GLUT-1 expression in vivo. 18F-FMISO uptake may serve as a potential biomarker for the detection of liver metastases in CRC, whereas its clinical use warrants validation.
Conflict of interest statement
The authors declare no competing interests.
Figures


Similar articles
-
Screening of radiotracer for diagnosis of colorectal cancer liver metastasis based on MACC1-SPON2.Abdom Radiol (NY). 2021 Jul;46(7):3227-3237. doi: 10.1007/s00261-021-03015-w. Epub 2021 Mar 13. Abdom Radiol (NY). 2021. PMID: 33712897 Free PMC article.
-
Evaluation of [18F]FDG/[18F]FLT/[18F]FMISO-based micro-positron emission tomography in detection of liver metastasis in human colorectal cancer.Nucl Med Biol. 2019 May-Jun;72-73:36-44. doi: 10.1016/j.nucmedbio.2019.07.004. Epub 2019 Jul 11. Nucl Med Biol. 2019. PMID: 31330410
-
18F-fluoromisonidazole positron emission tomography may be applicable in the evaluation of colorectal cancer liver metastasis.Hepatobiliary Pancreat Dis Int. 2019 Apr;18(2):164-172. doi: 10.1016/j.hbpd.2019.02.008. Epub 2019 Feb 26. Hepatobiliary Pancreat Dis Int. 2019. PMID: 30850340
-
18F-HX4/18F-FMISO-based micro PET for imaging of tumor hypoxia and radiotherapy-associated changes in mice.Biomed Pharmacother. 2019 Nov;119:109454. doi: 10.1016/j.biopha.2019.109454. Epub 2019 Sep 14. Biomed Pharmacother. 2019. PMID: 31526971
-
Impact of Fluorodeoxyglucose PET/Computed Tomography on the Management of Patients with Colorectal Cancer.PET Clin. 2015 Jul;10(3):345-60. doi: 10.1016/j.cpet.2015.03.007. Epub 2015 Apr 18. PET Clin. 2015. PMID: 26099671 Review.
Cited by
-
Transfer of metastatic traits via miR-200c in extracellular vesicles derived from colorectal cancer stem cells is inhibited by atractylenolide I.Clin Transl Med. 2020 Aug;10(4):e139. doi: 10.1002/ctm2.139. Clin Transl Med. 2020. PMID: 32898324 Free PMC article.
-
Screening of radiotracer for diagnosis of colorectal cancer liver metastasis based on MACC1-SPON2.Abdom Radiol (NY). 2021 Jul;46(7):3227-3237. doi: 10.1007/s00261-021-03015-w. Epub 2021 Mar 13. Abdom Radiol (NY). 2021. PMID: 33712897 Free PMC article.
-
Associations between GLUT expression and SUV values derived from FDG-PET in different tumors-A systematic review and meta analysis.PLoS One. 2019 Jun 17;14(6):e0217781. doi: 10.1371/journal.pone.0217781. eCollection 2019. PLoS One. 2019. PMID: 31206524 Free PMC article.
-
The critical role of glucose deprivation in epithelial-mesenchymal transition in hepatocellular carcinoma under hypoxia.Sci Rep. 2020 Jan 30;10(1):1538. doi: 10.1038/s41598-020-58124-1. Sci Rep. 2020. PMID: 32001727 Free PMC article.
References
Publication types
MeSH terms
Substances
LinkOut - more resources
Full Text Sources
Medical
Miscellaneous

