

Monitoring drug nanocarriers in human blood by near-infrared fluorescence correlation spectroscopy
- PMID: 30546066
- PMCID: PMC6294246
- DOI: 10.1038/s41467-018-07755-0
Monitoring drug nanocarriers in human blood by near-infrared fluorescence correlation spectroscopy
Abstract
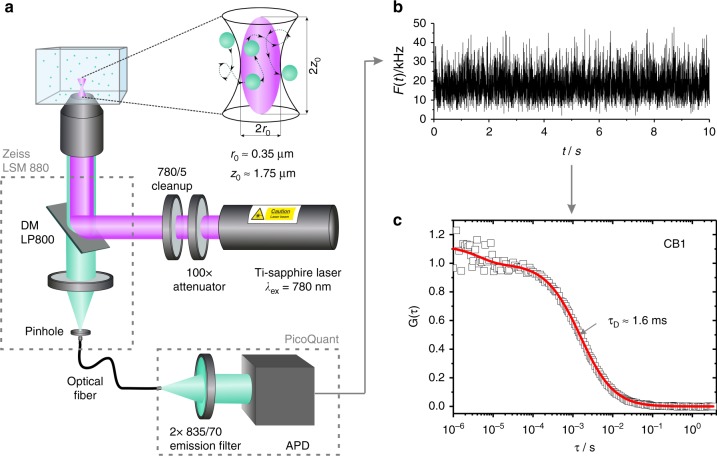
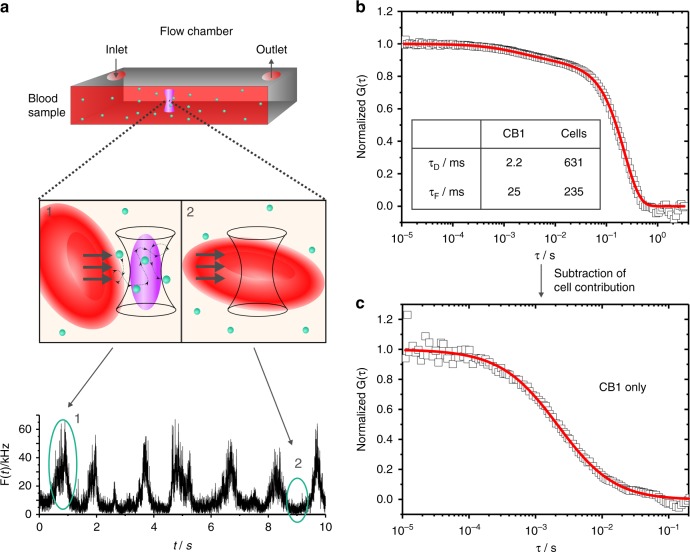
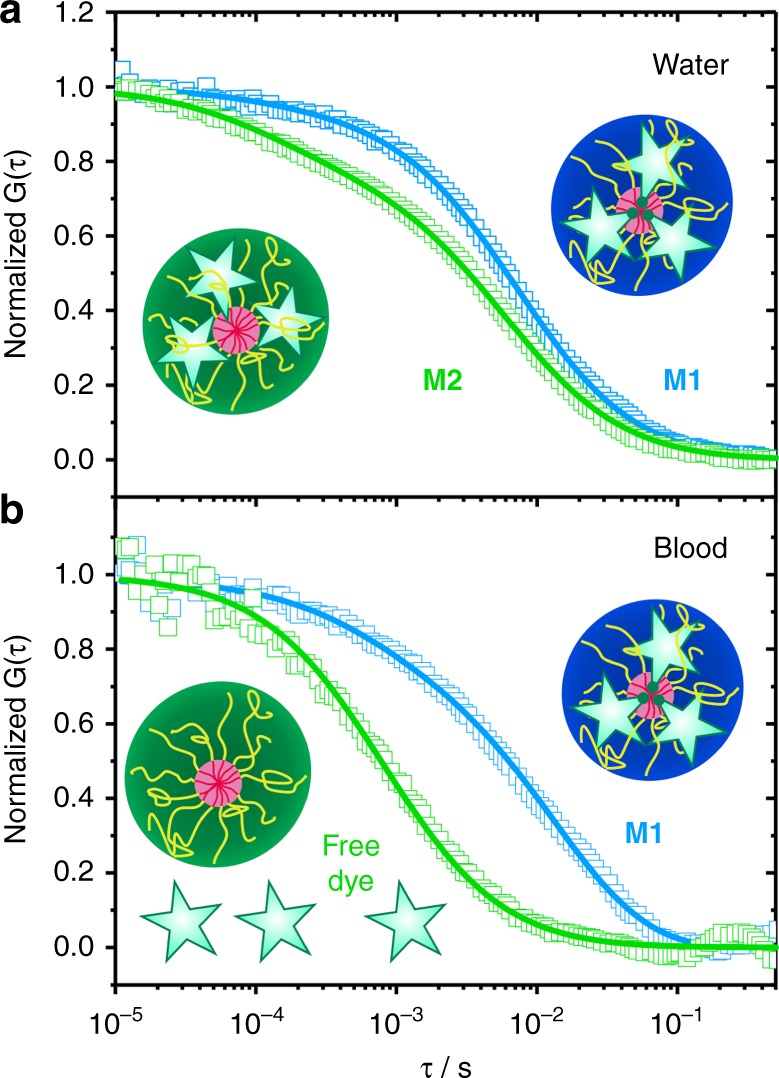
Nanocarrier-based drug delivery is a promising therapeutic approach that offers unique possibilities for the treatment of various diseases. However, inside the blood stream, nanocarriers' properties may change significantly due to interactions with proteins, aggregation, decomposition or premature loss of cargo. Thus, a method for precise, in situ characterization of drug nanocarriers in blood is needed. Here we show how the fluorescence correlation spectroscopy that is a well-established method for measuring the size, loading efficiency and stability of drug nanocarriers in aqueous solutions can be used to directly characterize drug nanocarriers in flowing blood. As the blood is not transparent for visible light and densely crowded with cells, we label the nanocarriers or their cargo with near-infrared fluorescent dyes and fit the experimental autocorrelation functions with an analytical model accounting for the presence of blood cells. The developed methodology contributes towards quantitative understanding of the in vivo behavior of nanocarrier-based therapeutics.
Conflict of interest statement
The authors declare no competing interests.
Figures

Similar articles
-
In vivo Near-infrared Fluorescence Tumor Imaging Using DiR-loaded Nanocarriers.Curr Drug Deliv. 2016;13(1):40-8. doi: 10.2174/1567201812666150703114908. Curr Drug Deliv. 2016. PMID: 26138681 Review.
-
Shining Light on Polymeric Drug Nanocarriers with Fluorescence Correlation Spectroscopy.Macromol Rapid Commun. 2022 Jun;43(12):e2100892. doi: 10.1002/marc.202100892. Epub 2022 Mar 7. Macromol Rapid Commun. 2022. PMID: 35174569 Review.
-
Fluorescence Correlation Spectroscopy Monitors the Fate of Degradable Nanocarriers in the Blood Stream.Biomacromolecules. 2022 Mar 14;23(3):1065-1074. doi: 10.1021/acs.biomac.1c01407. Epub 2022 Jan 21. Biomacromolecules. 2022. PMID: 35061359 Free PMC article.
-
A NIR-remote controlled upconverting nanoparticle: an improved tool for living cell dye-labeling.Nanotechnology. 2015 Oct 23;26(42):425102. doi: 10.1088/0957-4484/26/42/425102. Epub 2015 Sep 30. Nanotechnology. 2015. PMID: 26422130
-
Release, transfer and partition of fluorescent dyes from polymeric nanocarriers to serum proteins monitored by asymmetric flow field-flow fractionation.J Chromatogr A. 2021 Mar 29;1641:461959. doi: 10.1016/j.chroma.2021.461959. Epub 2021 Feb 1. J Chromatogr A. 2021. PMID: 33611111
Cited by
-
Performance of nanoparticles for biomedical applications: The in vitro/in vivo discrepancy.Biophys Rev (Melville). 2022 Feb 1;3(1):011303. doi: 10.1063/5.0073494. eCollection 2022 Mar. Biophys Rev (Melville). 2022. PMID: 38505225 Free PMC article. Review.
-
Concepts and Approaches to Reduce or Avoid Protein Corona Formation on Nanoparticles: Challenges and Opportunities.Adv Sci (Weinh). 2024 Sep;11(34):e2402935. doi: 10.1002/advs.202402935. Epub 2024 Jul 8. Adv Sci (Weinh). 2024. PMID: 38976560 Free PMC article. Review.
-
Degradation of Drug Delivery Nanocarriers and Payload Release: A Review of Physical Methods for Tracing Nanocarrier Biological Fate.Pharmaceutics. 2021 May 21;13(6):770. doi: 10.3390/pharmaceutics13060770. Pharmaceutics. 2021. PMID: 34064155 Free PMC article. Review.
-
Single Particle Chemical Characterisation of Nanoformulations for Cargo Delivery.AAPS J. 2023 Oct 2;25(6):94. doi: 10.1208/s12248-023-00855-w. AAPS J. 2023. PMID: 37783923 Review.
-
Lipid-Polyglutamate Nanoparticle Vaccine Platform.ACS Appl Mater Interfaces. 2021 Feb 10;13(5):6011-6022. doi: 10.1021/acsami.0c20607. Epub 2021 Jan 28. ACS Appl Mater Interfaces. 2021. PMID: 33507728 Free PMC article.
References
-
- Irvine DJ. Materializing the future of vaccines and immunotherapy. Nat. Rev. Mater. 2016;1:15008. doi: 10.1038/natrevmats.2015.8. - DOI
Publication types
MeSH terms
Substances
LinkOut - more resources
Full Text Sources
Research Materials
