Review
. 2019 Jan;4(1):10-19.
doi: 10.1038/s41564-018-0296-2. Epub 2018 Dec 13.

Tracking virus outbreaks in the twenty-first century

Affiliations
Review

Tracking virus outbreaks in the twenty-first century

Nathan D Grubaugh et al. Nat Microbiol. 2019 Jan.

Abstract

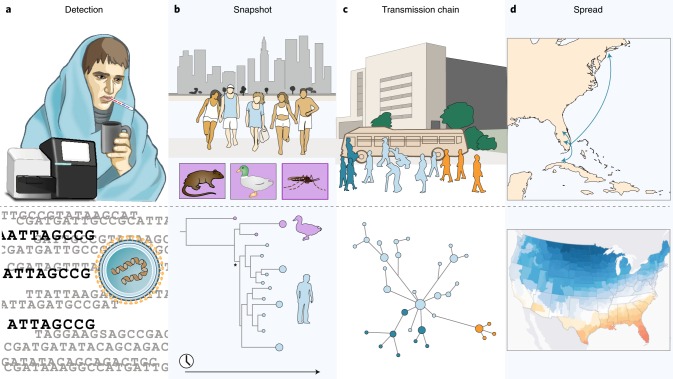
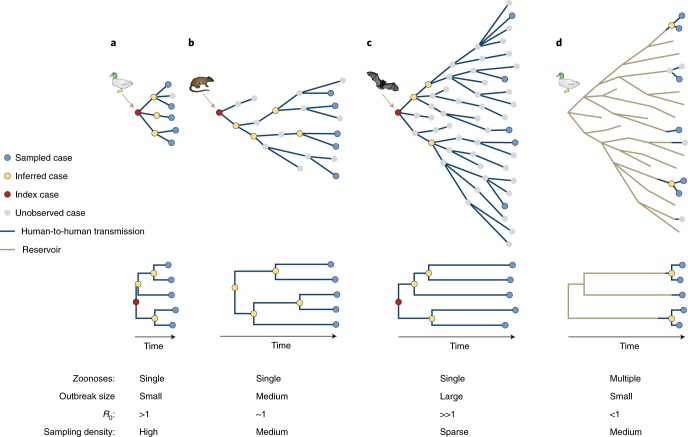
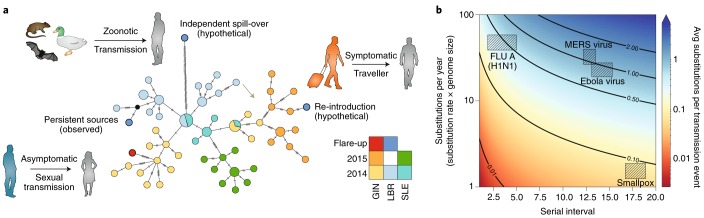
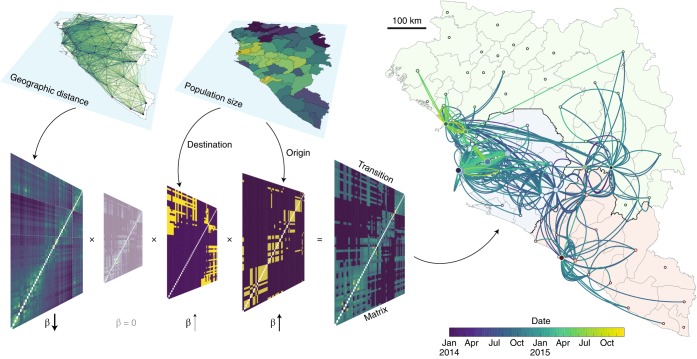
Emerging viruses have the potential to impose substantial mortality, morbidity and economic burdens on human populations. Tracking the spread of infectious diseases to assist in their control has traditionally relied on the analysis of case data gathered as the outbreak proceeds. Here, we describe how many of the key questions in infectious disease epidemiology, from the initial detection and characterization of outbreak viruses, to transmission chain tracking and outbreak mapping, can now be much more accurately addressed using recent advances in virus sequencing and phylogenetics. We highlight the utility of this approach with the hypothetical outbreak of an unknown pathogen, 'Disease X', suggested by the World Health Organization to be a potential cause of a future major epidemic. We also outline the requirements and challenges, including the need for flexible platforms that generate sequence data in real-time, and for these data to be shared as widely and openly as possible.


Conflict of interest statement

The authors declare no competing interests.

Figures

None
Real-time genomic investigation of Disease X. a, Metagenomic sequencing revealed that Disease X, which could not be identified using standard clinical assays, was a novel virus. b, Targeted sequencing from additional human cases and from related viruses uncovered the likely animal reservoir, the time period that it was introduced into the human population (represented by * in the lower panel), and that subsequent transmission was human-to-human. c, More intensive virus genome sequencing was used to construct detailed transmission chains and identify potential control measures. d, Layering additional climatic (pictured in the lower panel; https://www.climate.gov/maps-data), transportation, geographic, economic and demographic information into a large phylogenetic data set revealed the risk factors that facilitated local and global spread. Images and icons courtesy of S. Knemeyer.
Fig. 1
Fig. 1. Outbreak scenarios and the resulting phylogenetic trees of virus genomes from sampled human cases.
The first three scenarios show a single introduction from a non-human reservoir followed by human-to-human spread. a, A small outbreak from a recent zoonosis with a commensurately short tree, suggesting recent emergence. R0 is greater than 1, indicating the potential to cause a large outbreak. b, A medium-sized outbreak with a deeper tree and internal nodes dispersed. With R0 close to 1, this suggests that emergence into humans was not recent and its transmission potential is just sufficient to persist. The root of the tree is not the index case meaning the zoonosis could be older. c, A large outbreak with R0 greater than 1, and thus exhibiting exponential growth in case numbers. Distinctively for a growing epidemic, internal nodes tend to be towards the root of the tree, suggesting that only a small fraction of the total cases were sampled. d, A scenario of repeated zoonotic jumps with limited human to human transmission. The internal parts of the tree represent the diversity of the virus in the non-human reservoir and the human-to-human transmission cases are closely related. Icons courtesy of S. Knemeyer.
Fig. 2
Fig. 2. Transmission chain tracking during outbreaks using virus genomics.
a, Viral genome sequences were used to distinguish between competing hypotheses for the source of the viruses that triggered the Ebola flare-ups in West Africa. The three main hypotheses and their expected genomic signatures are illustrated here with a hypothetical haplotype network. Genomes from all of the observed flare-ups grouped closely with genomes sequenced from patients in the same country, from earlier in the outbreak (bottom left), consistent with transmission from persistent sources. In contrast, genomes linked to re-introductions from neighbouring countries (right) would be expected to cluster with genomes from a different country and from late in the outbreak. In the case of independent spillovers from a reservoir host (top left, that is, independent sampling from the diversity circulating within the reservoir), the spillover genomes would be linked to the main outbreak by a long branch originating from near the root of the network. GIN, Guinea; LBR, Liberia; SLE, Sierra Leone. b, Expected ‘genomic resolution’ for the inference of transmission chains at the level of individual infections. Resolution is dependent on the serial interval between infections (x-axis; used as a proxy for epidemiological generation time), as well as the genome size and nucleotide substitution rate (y-axis). Icons courtesy of S. Knemeyer.
Fig. 3
Fig. 3. Integration and testing predictors of phylogeographic spread.
We illustrate the concept of this approach using the 2013–2016 Ebola epidemic in West Africa. Geographic distances between all pairs of locations, in this case administrative areas in Guinea, Sierra Leone and Liberia, as well as population sizes at the origin and destination of these pairs are combined into a transition rate matrix through a generalized linear model. This matrix parameterizes the phylogenetic process of spread that is being estimated. Each predictor is associated with a coefficient, β, which denotes the strength of contribution with some predictors (for example, population size) positively associated with the intensity of migration whereas others (for example, geographic distance) are negatively associated. A coefficient of 0 implies that the predictor is excluded from the model (represented in the figure by the transparent matrix with β = 0).

Similar articles

Cited by

References

    1. Drosten C, et al. Identification of a novel coronavirus in patients with severe acute respiratory syndrome. N. Engl. J. Med. 2003;348:1967–1976. doi: 10.1056/NEJMoa030747. - DOI - PubMed
    1. Ksiazek TG, et al. A novel coronavirus associated with severe acute respiratory syndrome. N. Engl. J. Med. 2003;348:1953–1966. doi: 10.1056/NEJMoa030781. - DOI - PubMed
    1. Zaki AM, van Boheemen S, Bestebroer TM, Osterhaus ADME, Fouchier RAM. Isolation of a novel coronavirus from a man with pneumonia in Saudi Arabia. N. Engl. J. Med. 2012;367:1814–1820. doi: 10.1056/NEJMoa1211721. - DOI - PubMed
    1. Novel Swine-Origin Influenza A (H1N1) Virus Investigation Team et al. Emergence of a novel swine-origin influenza A (H1N1) virus in humans. N. Engl. J. Med. 2009;360:2605–2615. doi: 10.1056/NEJMoa0903810. - DOI - PubMed
    1. Smith GJD, et al. Origins and evolutionary genomics of the 2009 swine-origin H1N1 influenza A epidemic. Nature. 2009;459:1122–1125. doi: 10.1038/nature08182. - DOI - PubMed

Publication types

MeSH terms