. 2018 Nov 28:12:84.
doi: 10.3389/fninf.2018.00084. eCollection 2018.

A Cell Atlas for the Mouse Brain

Affiliations

A Cell Atlas for the Mouse Brain

Csaba Erö et al. Front Neuroinform. .

Erratum in

  • Corrigendum: A Cell Atlas for the Mouse Brain.
    Erö C, Gewaltig MO, Keller D, Markram H. Erö C, et al. Front Neuroinform. 2019 Feb 19;13:7. doi: 10.3389/fninf.2019.00007. eCollection 2019. Front Neuroinform. 2019. PMID: 30837861 Free PMC article.

Abstract

Despite vast numbers of studies of stained cells in the mouse brain, no current brain atlas provides region-by-region neuron counts. In fact, neuron numbers are only available for about 4% of brain of regions and estimates often vary by as much as 3-fold. Here we provide a first 3D cell atlas for the whole mouse brain, showing cell positions constructed algorithmically from whole brain Nissl and gene expression stains, and compared against values from the literature. The atlas provides the densities and positions of all excitatory and inhibitory neurons, astrocytes, oligodendrocytes, and microglia in each of the 737 brain regions defined in the AMBA. The atlas is dynamic, allowing comparison with previously reported numbers, addition of cell types, and improvement of estimates as new data is integrated. The atlas also provides insights into cellular organization only possible at this whole brain scale, and is publicly available.

Keywords: Allen brain atlas; cell numbers; glia; mouse brain; neurons.


Figures
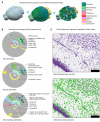
Figure 1
Figure 1
Current knowledge and decomposition of the mouse brain. (A) Illustration of the hierarchical definition of non-overlapping structures in the AMBA (Dong, 2008). The highest level comprises the entire brain, while the next level defines large brain structures such as olfactory bulb, cortex, or cerebellum. The next levels define progressively finer sub-structures. The color encodes the brain regions according to the AMBA, e.g., cortical areas are shown in green and cerebellar regions in yellow. (B) Illustration of the published information on densities or absolute numbers of cells, neurons, and glia in different regions of the mouse brain. Each disk is divided into rings and sectors. Each ring represents a hierarchical level in the AMBA and sectors represent the contained brain structures. The center of each disk represents the entire brain, each surrounding ring then represents the next hierarchy level. Colored areas represent regions where at least one study reports absolute numbers or densities, with color coded as in (A). Gray areas represent brain regions where no literature data is available. The following disks from top to bottom illustrate for which regions numbers or cell densities have been published for cells, neurons, and glial subtypes, respectively. Most information is available for cortical and cerebellar regions, while much less is known about subcortical regions. (C) Illustration of automatically counting cell soma from Nissl stains. Top, original Nissl stain from AIBS, with soma stained in blue. Bottom: overlaid cell positions as detected with a state-of-the-art detection algorithm. The algorithm performs well in areas where cell soma are well-separated. In areas where cells are so dense that cell soma overlap, automatic cell counting fails.
Figure 2
Figure 2
Workflow for generating cell positions for the whole mouse brain. (A) Illustration of the different processing steps of our workflow. The 1st panel shows the AIBS Nissl stained microscopy slices. These are processed to obtain a volumetric dataset of cell density throughout the brain, shown in the 2nd panel. The cell positions that are created from it using an acceptance-rejection algorithm are shown in the 3rd panel. Finally, the generated cells are differentiated by type, as shown in the 4th panel. The cell types shown are glial cells (green), excitatory neurons (blue) and inhibitory neurons (red). The different processing steps are illustrated in (B–E). (B) Illustration of how the volumetric dataset can be improved by automatic non-rigid alignment. Two regions in the volumetric dataset are shown as example, before and after non-rigid realignment. An improvement in the cohesion of the brain structures can be clearly seen. (C) Coronal slice of the genetic marker Nrn1 before and after thresholding, showing the additional dye uniformly present even in brain regions that lack the genetically targeted cells. Thus, the average signal outside of the brain volume was subtracted from the total signal. While this procedure had little effect on the Nissl stained slices, it had more impact on the genetic markers that were used in the later stages of this paper. (D) Illustration of how cells overlap when observed on a 2-dimensional plane such as a microscopy image. This effect was corrected by a mathematical function which was applied to approximate the actual number of cells as a function of the observed voxel intensity. This function was numerically validated, and then applied to the entire density dataset. (E) Acceptance-rejection algorithm used for the generation of cell positions. This is an iterative step, and was repeated until the targeted number of cells in the brain was reached. (F) Comparison between the original Nissl stained slice and its virtual counterpart, obtained using the cell positions generated in our workflow, in coronal view. Both show similar structures and correlate quite well despite the generated cells being displayed as simple spheres of uniform size. (G) Virtual slice obtained using the cell positions generated in our workflow, in sagittal view.
Figure 3
Figure 3
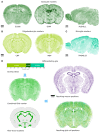
Differentiation of glial cells. (A–C) Illustration of the variety of genetic markers that were used to obtain an approximation of glia density. The colors represent astrocyte markers (A), oligodendrocyte markers (B), and microglia markers (C). Some of the marker experiments were only available in sagittal view and are therefore shown in that arrangement. All markers exhibit a fairly high resolution, as the microscopy slices were manually realigned using a non-rigid landmark based alignment. Some imaging artifacts are visible and cannot be corrected. (D) Top left: the 3 markers were combined with the illustrated ratios. The resulting volumetric dataset was used as an approximation for glia density throughout the brain volume. Bottom left: the regions shown in green are the AIBS annotated fiber tracts that are known to only contain non-neuronal cells. Top right: remaining neuron positions in a virtual slice after the differentiation procedure. Bottom right: glia cells differentiated during the procedure. Colors are as in (A–C).
Figure 4
Figure 4
Neuron differentiation into excitatory and inhibitory types. (A) Illustration of genetic marker experiments used to distinguish inhibitory from excitatory neurons. The inhibitory marker is shown in red while the excitatory marker is blue. The two markers exhibit clear differences in terms of density, especially in the thalamic regions. Both marker experiments were realigned manually using landmark based non-rigid alignment. Some imaging artifacts are visible and cannot be corrected. (B) Top left: the 2 markers were combined with the illustrated ratios from literature. Bottom left: regions shown in red that are known to contain only inhibitory neurons. This additional constraint was applied to the differentiation procedure. Right: virtual slice showing positions of inhibitory and excitatory neurons. Colors are as in (A). Similarly, to the markers, the same regions seem to exhibit a fairly high density of inhibitory neurons, while others are mostly excitatory.
Figure 5
Figure 5
Reconstructed cell positions and types in the mouse brain. (A,B) Global overview of positions and types of all generated cells. (A) Labeled cells in the full 3D volume with outside boundary of the brain shown for clarity. (B) In silico coronal slice of 25 μm thickness. Glial cells are shown in green, inhibitory and excitatory neurons are shown red and blue, respectively. The cerebellum and the hippocampus are clearly visible due to their high cell densities and their distinctive shapes. (C,D) Composition of all regions of the mouse brain, in terms of cells, neurons and glia. Display and colors as in Figure 1B but with the estimates generated by our workflow. Gray areas represent fiber tracts.
Figure 6
Figure 6
Relation between cell, glia, and neuron densities across brain regions. Color codes the brain region according to the AMBA notation (colorbar to the right). (A–C) Histogram of brain regions in terms of their density for cells, neurons and glia. Each region is shown with the same size, on a logarithmic density axis. (D,E) Inter-dependence between glia and cell densities, shown with (top) and without (bottom) the cerebellum. The granule layers of the cerebellum become isolated due to their extremely high density. Hierarchically close regions often tend to form clusters, even though no regional distinction was made during the workflow. DGGCL, Dentate gyrus, granule cell layer; PGL, Paraflocculus, granular layer; SLGL, Simple lobule, granular layer; LIIIIGL, Lobule III, granular layer; RAVPL2, Retrosplenial area, ventral part, layer 2; MH, Medial habenula; FCCAPL, Field CA3, pyramidal layer; PHNMDMMP, Paraventricular hypothalamic nucleus, magnocellular division, medial magnocellular part; MIOCC, Major island of Calleja. (F,G) Inter-dependence between neuron and cell densities, shown with (top) and without (bottom) the cerebellum. The dashed line represents equal densities, where cells would be comprised of only neurons. FVVIIML, Folium-tuber vermis VII, molecular layer; FVVIIGL, Folium-tuber vermis VII, granular layer; LIGL, Lingula I, granular layer; PVIIIML, Pyramus VIII, molecular layer; FCCAPL, Field CA2, pyramidal layer; SO, Subfornical organ; DGGCL, Dentate gyrus, granule cell layer; MH, Medial habenula. (H,I) Inter-dependence between glia and neuron densities, shown for excitatory neurons (top) and inhibitory neurons (bottom). C1GL, Crus 1, granular layer; PGL, Paraflocculus, granular layer; SLGL, Simple lobule, granular layer; LIIIIGL, Lobule III, granular layer; VAL1, posteromedial visual area, layer 1; C2GL, Crus 2, granular layer; CPGL, Copula pyramidis, granular layer; PHNPP, Periventricular hypothalamic nucleus, posterior part; RADPL1, Retrosplenial area, dorsal part, layer 1.
Figure 7
Figure 7
Validation of generated cell, glia and neuron densities against literature data and counted numbers. (A) Comparison between generated densities of different cell types and literature values reporting the same quantity, and that were not used during the generation process. When multiple literature sources are available for the exact same region, they are both shown as a data point and are linked together. The color encodes the brain regions according to the AMBA, while the shapes of the points encode for cell types. The middle line delimits equal quantities, while the dashed line shows the average deviation of 2.7-fold between literature values reporting on the same region. Data points outlined in black originate from Herculano-Houzel et al. (2013). This comparison includes Murakami et al. (2018) and Kim et al. (2017) who provided the majority of numbers for neurons and inhibitory neurons. (B) Comparison between cell densities generated, and counted by the automatic point-detection algorithm for every region of the brain. Colors are as in (A). The middle line delimits equal quantities. The data points for cell density that are available in literature and are also shown in (A), are represented as black dots for comparison. (C) Contribution of average soma size to the relative error between generated and counted cell densities, for each region. The relative error was defined as the difference between generated and counted densities, divided by the counted densities. Overall, most regions seem to exhibit a relative error of 10% between the two methods, with the lowest deviations reaching 0.1% and the highest being around 1,000% mostly for cerebellar regions. The lack of correlation shows that the density approximation was not systematically undermined by the deviations in the observed soma size. (D) Histograms of regions in the brain according to cell density, for generated (blue) and counted (green) numbers. The main difference lies in the long-tail which is only present for the generated numbers, as the counting algorithm does not work properly for highly dense regions. (E) Average soma size per region, approximated by the automatic counting algorithm, and shown in coronal view. (F) Different cortical regions as seen on the original Nissl stained slice from AIBS, with their average cell densities obtained from our generation algorithm (G), our automatic point-detection algorithm (C), and from literature (Herculano-Houzel et al., 2013) (H).
Figure 8
Figure 8
Web-based Cell Atlas providing an overview of all neurons and glia in the brain. (A) Global view of the cell atlas, allowing the selection of multiple regions and their display in 3D, color-coded according to the Allen Brain Atlas (Dong, 2008). The website displays 1% of all cells as small dots, at their reconstructed position in space. The cell counts and densities are shown on the left panel, along with the selected regions. The positions and densities of all cells in the brain can be downloaded. (B) Coronal view of the brain, showing 100% of cells in a 25 μm–thick virtual slice. The colors reflect cell type in this case, but can be changed with a dynamic interface. (C) Regions can be selected and studied individually, as shown here for the Hippocampus. (D) Validation panel, comparing the Cell Atlas densities for each selected region and cell type, with their literature counterparts. Each dot represents a literature number on a linear or logarithmic axis, and can be selected to access the underlying literature reference. White dot represents our reconstructed number for the selected region. (E) Contribution panel, allowing external users to enter region and cell type specific numbers for further validation. This encourages a collaborative effort to accumulate further literature numbers, and converge toward a ground-truth.

References

    1. Binder M. D., Xiao J., Kemper D., Ma G. Z. M., Murray S. S., Kilpatrick T. J. (2011). Gas6 increases myelination by oligodendrocytes and its deficiency delays recovery following cuprizone-induced demyelination. PLoS ONE 6:e17727. 10.1371/journal.pone.0017727 - DOI - PMC - PubMed
    1. Cahoy J. D., Emery B., Kaushal A., Foo L. C., Zamanian J. L., Christopherson K. S., et al. . (2008). A transcriptome database for astrocytes, neurons, and oligodendrocytes: a new resource for understanding brain development and function. J. Neurosci. 28, 264–278. 10.1523/JNEUROSCI.4178-07.2008 - DOI - PMC - PubMed
    1. Charron G., Doudnikoff E., Canron M.-H., Li Q., Véga C., Marais S., et al. . (2014). Astrocytosis in parkinsonism: considering tripartite striatal synapses in physiopathology? Front. Aging Neurosci. 6:258. 10.3389/fnagi.2014.00258 - DOI - PMC - PubMed
    1. Dong H. W. (2008). The Allen Reference Atlas: A Digital Color Brain Atlas of the C57Bl/6J Male Mouse. Hoboken, NJ: John Wiley & Sons Inc.
    1. Förster J. (2008). Quantitative Morphological Analysis of the Neostriatum and the Cerebellum of Tenascin-C Deficient Mice. Doctoral Dissertation, University of Hamburg-Eppendorf; Hamburg, Germany.

Publication types

LinkOut - more resources