Co-expression network analysis of gene expression profiles of HER2+ breast cancer-associated brain metastasis
- PMID: 30546434
- PMCID: PMC6256326
- DOI: 10.3892/ol.2018.9562
Co-expression network analysis of gene expression profiles of HER2+ breast cancer-associated brain metastasis
Abstract
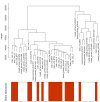
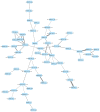
Brain metastasis occurs in ~30% of patients with breast cancer, and patients with human epidermal growth factor receptor 2 (HER2)+ breast cancer have a particularly high frequency of brain metastasis. Weighted gene co-expression network analysis was conducted to identify the hub differentially expressed genes from patients with HER2+ breast cancer between brain metastases and primary tumors. The potential candidate genes were investigated in another set of patient samples to confirm their relevance. The results indicated that a number of pathways altered significantly when breast cancer metastasized to the brain. Cyclophilin A (CypA) and ribosomal protein L17 (RPL17) were overexpressed in breast cancer-associated brain metastases, whereas tumor protein 63 (TP63) and von Willebrand factor A domain-containing 8 (VWA8) were significantly downregulated in breast cancer brain metastases. Furthermore, the expression of CypA and RPL17 in brain metastases were significantly increased compared with that in primary breast tumors, and the expression of TP63 and VWA8 in brain metastases were significantly decreased. This result indicated that the significant differences in expression observed between primary breast tumors and brain metastases were derived from significantly altered systems, including gene modules rather than single genes.
Keywords: brain metastasis; breast cancer; expression profile; human epidermal growth factor receptor 2+; weighted gene co-expression network analysis.
Figures


Similar articles
-
Frequent genetic alterations in EGFR- and HER2-driven pathways in breast cancer brain metastases.Am J Pathol. 2013 Jul;183(1):83-95. doi: 10.1016/j.ajpath.2013.03.023. Epub 2013 May 9. Am J Pathol. 2013. PMID: 23665199
-
Discordances in ER, PR, and HER2 between primary breast cancer and brain metastasis.J Neurooncol. 2018 Apr;137(2):295-302. doi: 10.1007/s11060-017-2717-0. Epub 2017 Dec 19. J Neurooncol. 2018. PMID: 29260362 Free PMC article.
-
Identification of the key pathways and genes involved in HER2-positive breast cancer with brain metastasis.Pathol Res Pract. 2019 Aug;215(8):152475. doi: 10.1016/j.prp.2019.152475. Epub 2019 Jun 1. Pathol Res Pract. 2019. PMID: 31178227
-
[Immunohistochemical hormonal mismatch and human epidermal growth factor type 2 [HER2] phenotype of brain metastases in breast cancer carcinoma compared to primary tumors].Neurochirurgie. 2016 Jun;62(3):151-6. doi: 10.1016/j.neuchi.2016.01.007. Epub 2016 May 25. Neurochirurgie. 2016. PMID: 27236733 French.
-
Brain metastasis in breast cancer: a comprehensive literature review.J Neurooncol. 2016 May;127(3):407-14. doi: 10.1007/s11060-016-2075-3. Epub 2016 Feb 24. J Neurooncol. 2016. PMID: 26909695 Review.
Cited by
-
Cancer metastases: Tailoring the targets.Heliyon. 2024 Aug 2;10(15):e35369. doi: 10.1016/j.heliyon.2024.e35369. eCollection 2024 Aug 15. Heliyon. 2024. PMID: 39170575 Free PMC article. Review.
-
Identification of Hub Genes Associated With Tuberculous Pleurisy by Integrated Bioinformatics Analysis.Front Genet. 2021 Dec 3;12:730491. doi: 10.3389/fgene.2021.730491. eCollection 2021. Front Genet. 2021. PMID: 34925441 Free PMC article.
-
Gene Expression and miRNAs Profiling: Function and Regulation in Human Epidermal Growth Factor Receptor 2 (HER2)-Positive Breast Cancer.Cancers (Basel). 2019 May 10;11(5):646. doi: 10.3390/cancers11050646. Cancers (Basel). 2019. PMID: 31083383 Free PMC article. Review.
-
A Novel Overall Survival Prediction Signature Based on Comprehensive Research in Prostate Cancer Bone Metastases.Front Med (Lausanne). 2022 Jun 16;9:815541. doi: 10.3389/fmed.2022.815541. eCollection 2022. Front Med (Lausanne). 2022. PMID: 35783639 Free PMC article.
-
Von Willebrand factor A domain-containing protein 8 (VWA8) localizes to the matrix side of the inner mitochondrial membrane.Biochem Biophys Res Commun. 2020 Jan 1;521(1):158-163. doi: 10.1016/j.bbrc.2019.10.095. Epub 2019 Oct 17. Biochem Biophys Res Commun. 2020. PMID: 31630795 Free PMC article.
References
-
- Brufsky AM, Mayer M, Rugo HS, Kaufman PA, Tan-Chiu E, Tripathy D, Tudor IC, Wang LI, Brammer MG, Shing M, et al. Central nervous system metastases in patients with HER2-positive metastatic breast cancer: Incidence, treatment, and survival in patients from registHER. Clin Cancer Res. 2011;17:4834–4843. doi: 10.1158/1078-0432.CCR-10-2962. - DOI - PubMed
LinkOut - more resources
Full Text Sources
Research Materials
Miscellaneous
