. 2018 Oct 16;8(1):e1518672.
doi: 10.1080/2162402X.2018.1518672. eCollection 2019.

Virotherapy-recruited PMN-MDSC infiltration of mesothelioma blocks antitumor CTL by IL-10-mediated dendritic cell suppression

Affiliations

Virotherapy-recruited PMN-MDSC infiltration of mesothelioma blocks antitumor CTL by IL-10-mediated dendritic cell suppression

Zhiwu Tan et al. Oncoimmunology. .

Abstract

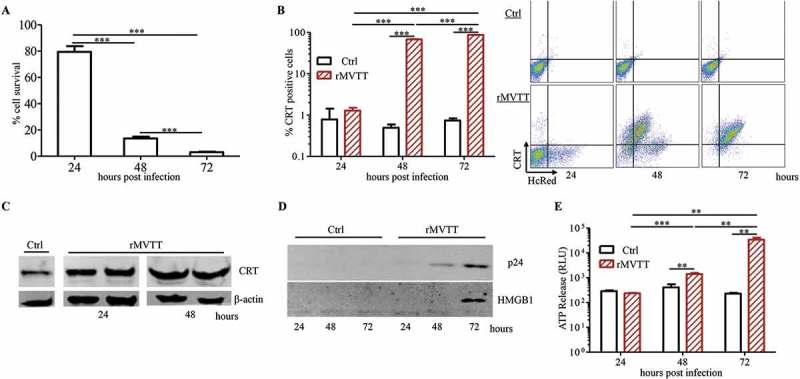
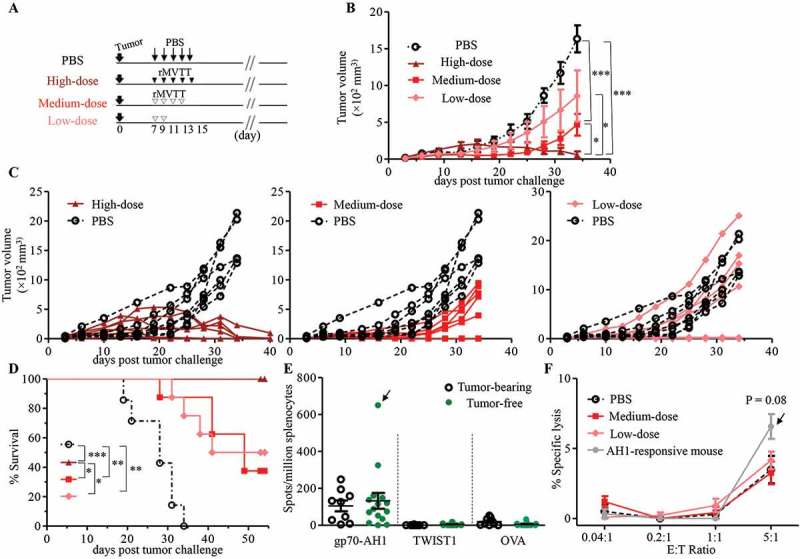
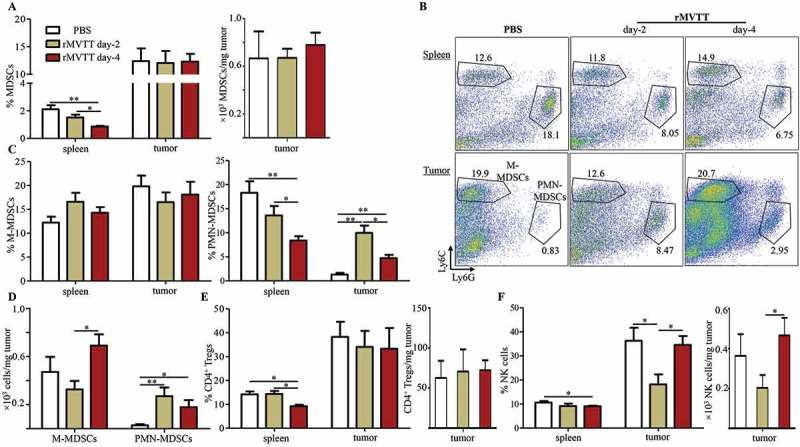
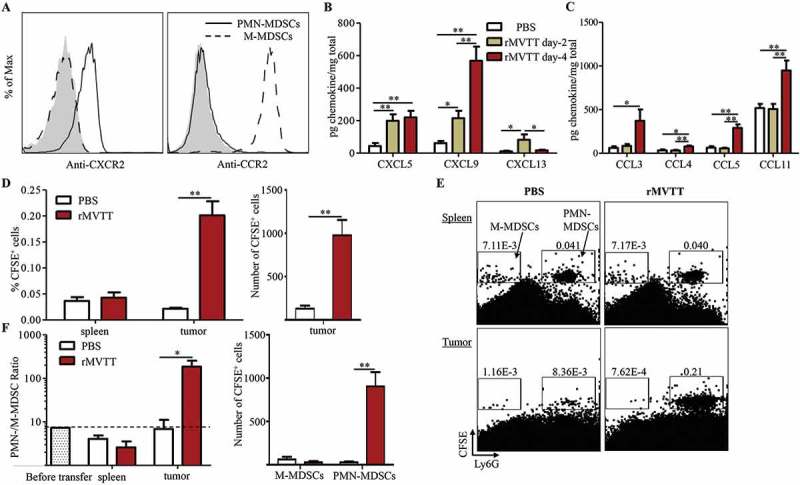
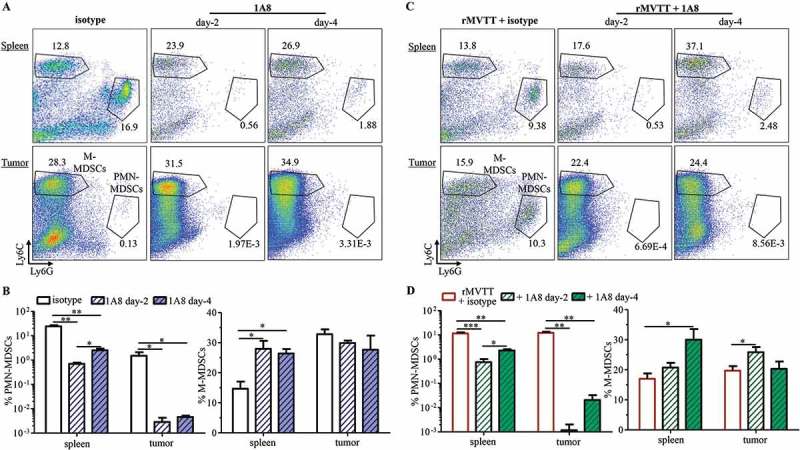
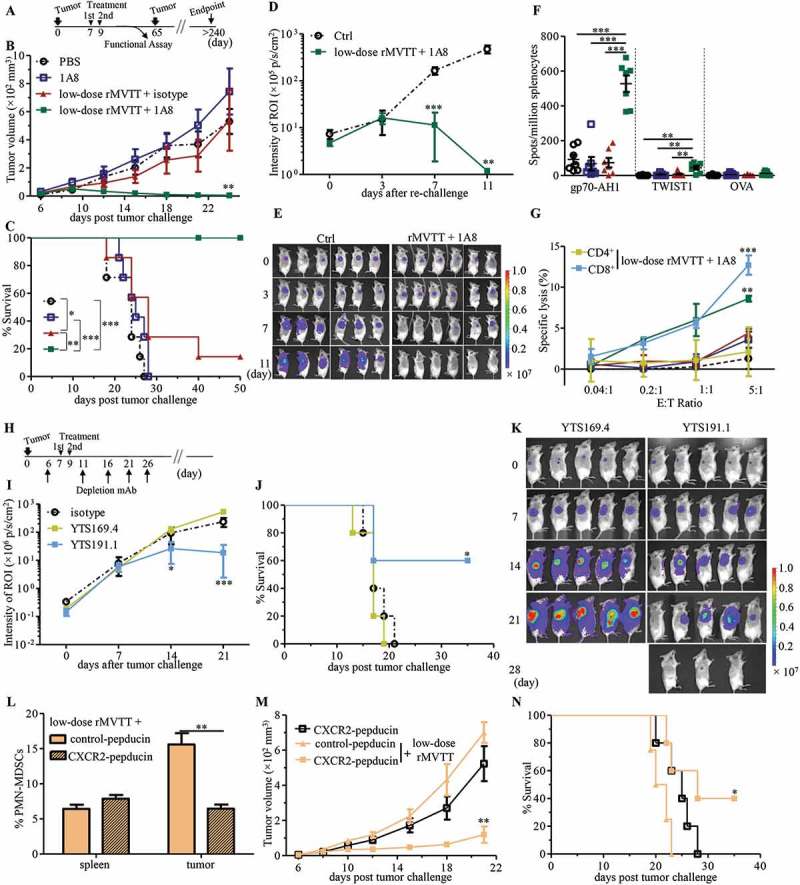
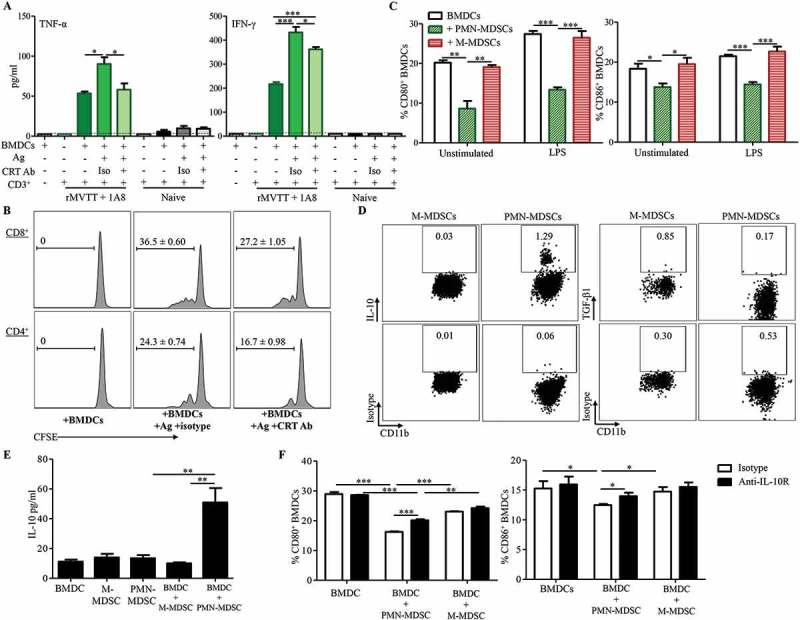
Antitumor cytotoxic T lymphocytes (CTLs) are essential for immune surveillance, yet the blockade of eliciting such CTLs during oncolytic virotherapy remains incompletely understood. Here, we show that oncolysis of mesothelioma by modified vaccinia Tiantan (MVTT) induces damage-associated molecular patterns exposure. Although MVTT leads to regression of established mesothelioma dose-dependently, antitumor CTLs are rarely induced. Mechanistically, MVTT virotherapy generates C-X-C chemokines that recruit CXCR2-expressing polymorphonuclear myeloid-derived suppressor cells (PMN-MDSCs) into tumor microenvironment, where they suppress dendritic cells (DCs) by producing IL-10 and halt CTL responses. During the virotherapy, however, depletion of PMN-MDSCs but not of monocytic (M)-MDSCs results in the induction of potent antitumor CTLs that not only eradicate established mesothelioma but also prevent the second tumor challenge. Our findings suggest that vaccinia virotherapy may combine strategies that prevent the chemotactic recruitment of PMN-MDSCs, block their suppression on DCs or deplete PMN-MDSCs in order to induce potent CTLs for tumor eradication.

Keywords: CTLs; MDSCs; Modified vaccinia Tiantan; mesothelioma; virotherapy.


Figures

Figure 1.
Figure 1.
MVTT-mediated oncolysis of AB1 cells triggers exposure of CRT as well as release of HMGB1 and ATP. (A) AB1 cell viability upon infection with 0.2 MOI rMVTT. CRT expression on AB1 cells was detected with an anti-CRT antibody and analyzed either by flow cytometric analysis (B) or western blot analysis (C). β-actin served as the internal control showing that similar amounts of proteins were used for analysis. (D) Western blot analysis of released HMGB1 in culture supernatants after rMVTT infection. (E) Released ATP levels in the culture supernatant. Ctrl, culture medium alone. Data shown are representative of two independent experiments.
Figure 2.
Figure 2.
MVTT treatment eliminated established AB1 tumors in a dose-dependent manner, yet failed to induce antitumor T cell immunity in BALB/c mice. (A) Schematic representation of our therapeutic study of AB1 tumor-bearing mice using different doses of rMVTT. Solid AB1 mesothelioma tumors were established with s.c inoculation of 5 × 105 AB1 cells 7 days prior to treatment. In the high-dose group (n = 8), 1 × 108 PFU rMVTT per dose was delivered i.t every 2 days for 5 injections, whereas in the medium-dose group (n = 8) 1 × 107 PFU per injection was given i.t 4 times, and 2 injections were given to the low-dose group (n = 8). (B) Tumor volumes of each group were measured over time with a caliper. (C) Individual tumor growth curve. Every line represents one mouse. (D) Survival curve, taken as time to tumor length > 15 mm, was determined by caliper measurement. (E) T cell responses in splenocytes. Secreted IFN-γ was quantified by ELISpot assay after ex vivo stimulation of splenocytes with gp70-AH1 and TWIST1 peptides or the control peptide ovalbumin (OVA257-264). Only one tumor-free mouse from the medium-dose group showed a strong response against the gp70-AH1 epitope, as indicated by the arrow. (F) CTL assay of CD3+ T cells isolated from tumor-free mice towards AB1 cells at different effector:target (E:T) ratios. The grey line represents CTL activity of CD3+ T cells from the mouse with strong AH1 responses. P = 0.08, compared to the PBS group. The experiment was repeated 2 times.
Figure 3.
Figure 3.
MVTT treatment recruited PMN-MDSCs into the TME. (A) Percentage of total MDSCs in the spleen and tumor (left panel) and absolute cell number of MDSCs in the tumor (right panel). Numbers of MDSCs per milligram of tumor at the indicated time points were calculated. (B) Representative dot plots showing populations of PMN-MDSCs and M-MDSCs within CD11b+ cells in the spleen and tumor. Numbers indicate cell proportions. (C) Percentages of MDSC subsets were calculated for M-MDSCs (left panel) and PMN-MDSCs (right panel). (D) Absolute cell numbers of M-MDSCs and PMN-MDSCs in the tumor. Numbers of PMN-MDSCs or M-MDSCs per milligram of tumor at the indicated time points were calculated. (E) Percentage of NK cells in the spleen and tumor (left panel) and absolute cell number of NK cells in the tumor (right panel). (F) Percentage of CD4+ Tregs in the spleen and tumor (left panel) and absolute cell number of CD4+ Tregs in the tumor (right panel). Graphs show cumulative data from two separate experiments (n = 7).
Figure 4.
Figure 4.
Trafficking of PMN-MDSCs into the TME by MVTT-induced chemotaxis. (A) Flow cytometric analysis of chemokine receptor expression on splenic PMN-MDSCs and M-MDSCs from AB1 tumor-bearing mice. Representative histogram plots are shown from 3 independent experiments; the shaded region represents an isotype control. Expression of C-X-C chemokines (B) and C-C chemokines (C) in tumor homogenates after rMVTT treatment. (D) Frequencies (left panel) and absolute numbers (right panel) of CFSE-labelled total MDSCs in both spleen and tumor 24 hours after treatment. Each mouse received 50 µl PBS or rMVTT (1 × 107 PFU). (E) Migrated M-MDSCs and PMN-MDSCs in the tumor 24 hours after treatment. Representative dot plots are shown with numbers indicating gated cell proportions relative to total singlets. (F) Changes in the ratio of the PMN-MDSC proportion to the M-MDSC proportion were analyzed (left panel). PMN-/M-MDSC ratio measured before adoptive transfer was shown as baseline. Changes in the absolute numbers of M-MDSCs and PMN-MDSCs in the tumor are shown (right panel). Graphs show the cumulative data from two separate experiments (n = 6).
Figure 5.
Figure 5.
Preferential depletion of MDSC subsets by antibody and peptibody treatment. (A) Representative dot plots gated on CD11b+ cells showing populations of PMN-MDSCs and M-MDSCs in the spleen and tumor 2 days and 4 days after receiving i.t injection of 100 µg of either 1A8 or anti-rat IgG2a (clone: 2A3) isotype control. Numbers within dot plots represent cell proportions. (B) Changes in frequencies were calculated with PMN-MDSCs (left panel) and M-MDSCs (right panel). (C) Representative dot plots showing population of PMN-MDSCs and M-MDSCs in the spleen and tumor 2 days and 4 days after combination treatment. 100 µg of either 1A8 or isotype 2A3 were combined with 1 × 107 PFU rMVTT and i.t injected into AB1 mesothelioma. (D) Analysis of frequencies of PMN-MDSCs (left panel) and M-MDSCs (right panel) after combination treatment. Graphs show cumulative data from two separate experiments (n = 5).
Figure 6.
Figure 6.
Depletion of PMN-MDSCs enhances MVTT treatment efficacy by inducing antitumor T cell immunity. (A) Schematic representation of treatment schedule. 5 × 105 AB1 cells were s.c inoculated into BALB/c mice and grown for 7 days, following i.t administration of rMVTT (n = 7), 1A8 antibody (n = 7), combined rMVTT and 1A8 (n = 6) or PBS control (n = 7). An additional treatment was scheduled at day 9 in each group. Tumor growth (**P = 0.0069 compared to PBS-treated group) (B) and survival curves (C) of mice were calculated. 40 days after tumor ablation, protected mice (n = 6) in the combined rMVTT and 1A8 group were re-challenged and measured for tumor growth (D) with representative bioluminescence images of AB1-Luc tumors (E). Ctrl, naïve BALB/c mice. (F) T cell responses in splenocytes measured by ELISpot assay. (G) In vitro cytotoxic activity of CD3+ T cells in each group, or CD4+ and CD8+ T cells from the combined rMVTT and 1A8 group, towards AB1 cells at different effector:target (E:T) ratios. (H) Schematic representation for T cell depletion experiments with 2 administrations of combined rMVTT and 1A8 therapy (n = 5). 5 × 105 AB1-Luc cells were s.c inoculated. AB1-Luc tumor growth (I) and survival curve (J) of combined rMVTT and 1A8-treated mice with CD8+ T cell depletion (YTS169.4) or CD4+ T cell depletion (YTS191.1), or AB1-Luc tumor-bearing mice receiving only LTF-2 control antibody (isotype). (K) Representative bioluminescence images of AB1-Luc tumors in T cell depletion groups. BALB/c mice bearing 6-day AB1 tumors were treated with 2.5 mg/kg control-pepducin or CXCR2-pepducin, followed by 1 mg/kg pepducin daily for the duration of the study. rMVTT were given i.t at day 7 and percentages of PMN-MDSCs in the spleen and tumor were analyzed at day 9 (L). An additional rMVTT were administrated at day 9. Tumor growth (**P = 0.0063 compared to CXCR2-pepducin-treated group) (M) and survival curves (N) of mice (n = 5 for each group) were calculated.
Figure 7.
Figure 7.
PMN-MDSCs prevent the induction of antitumor T cell immunity by restricting DC activation. (A) Cytokine production following incubation of CD3+ T cells with antigen-pulsed BMDCs. BMDCs were pulsed with rMVTT-treated AB1 cell supernatants overnight, following washing with culture medium. Then, purified CD3+ T cells were added and culture supernatants were collected for analysis of cytokine production. Anti-CRT antibody or isotype control were present in several of the cultures during antigen-pulsing. Naïve, purified CD3+ T cells from naïve BALB/c mice. (B) Proliferation of CFSE-labelled CD3+ T cells after co-culture with antigen-pulsed BMDCs. Representative histogram plots are shown with numbers in each plot indicating proliferating populations. (C) Expression of CD80 and CD86 on BMDCs pulsed with culture medium (Unstimulated) or LPS. Purified PMN-MDSCs or M-MDSCs were labelled with CFSE and were present in the culture at a ratio of 2:1 with BMDCs. Graphs from (A) to (C) show cumulative data from two separate experiments. (D) Frequencies of IL-10+ and TGF-β1+ PMN-MDSCs and M-MDSCs. Representative dot plots from 3 independent experiments are shown with numbers indicating positive cell populations in each gate. (E) Production of IL-10 was enhanced by crosstalk between PMN-MDSCs and BMDCs. 5 × 104 purified PMN-MDSCs or M-MDSCs were present in the culture with or without 1 × 105 BMDCs (BMDC:MDSC = 1:2). Supernatant were collected at 4 days post incubation and measured for cytokine production. (F) Expression of CD80 and CD86 on LPS-activated BMDCs in the presence of IL-10 receptor blocking antibody or isotype control. Purified PMN-MDSCs or M-MDSCs were labelled with CFSE and were present in the culture at a ratio of 2:1 with BMDCs. IL-10 receptor was blocked by anti-IL-10R antibody (5 µg/ml) before BMDCs were stimulated with 100 ng/ml LPS. Graphs from (E) to (F) show representative data from two separate experiments.

Similar articles

Cited by

References

    1. Yap TA, Aerts JG, Popat S, Fennell DA.. Novel insights into mesothelioma biology and implications for therapy. Nat Rev Cancer. 2017;17:475–488. doi:10.1038/nrc.2017.42 - DOI - PubMed
    1. Rusch VW. Pemetrexed and cisplatin for malignant pleural mesothelioma: a new standard of care? J Clin Oncol. 2003;21:2629–2630. doi:10.1200/JCO.2003.02.043 - DOI - PubMed
    1. Dozier J, Zheng H, Adusumilli PS. Immunotherapy for malignant pleural mesothelioma: current status and future directions. Transl Lung Cancer Res. 2017;6:315–324. doi:10.21037/tlcr.2017.05.02 - DOI - PMC - PubMed
    1. Fukuhara H, Ino Y, Todo T. Oncolytic virus therapy: A new era of cancer treatment at dawn. Cancer Sci. 2016;107:1373–1379. doi:10.1111/cas.13027 - DOI - PMC - PubMed
    1. Kaufman HL, Kohlhapp FJ, Zloza A. Oncolytic viruses: a new class of immunotherapy drugs. Nat Rev Drug Discov. 2015;14:642–662. doi:10.1038/nrd4663 - DOI - PMC - PubMed

Publication types

LinkOut - more resources