. 2018 Sep 26;8(1):e1522471.
doi: 10.1080/2162402X.2018.1522471. eCollection 2019.

TGF-β enhances the cytotoxic activity of Vδ2 T cells

Affiliations

TGF-β enhances the cytotoxic activity of Vδ2 T cells

Christian Peters et al. Oncoimmunology. .

Abstract

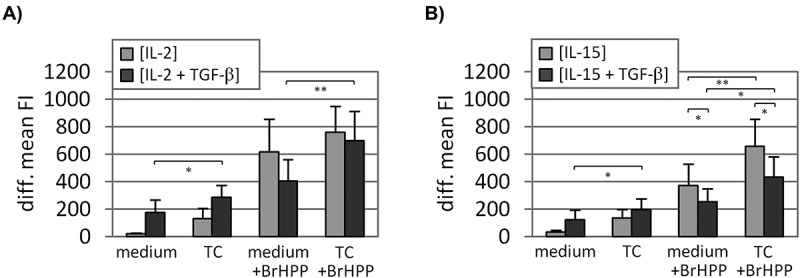
TGF-β is a pleiotropic cytokine with multiple roles in immunity. Apart from its suppressive activity, TGF-β is a driving cytokine in the differentiation of induced regulatory T cells (iTreg) but also in the polarization of interleukin-9 (IL-9) producing T helper 9 (Th9) T cells. Human Vδ2 expressing γδ T cells exert potent cytotoxicity towards a variety of solid tumor and leukemia/lymphoma target cells and thus are in the focus of current strategies to develop cell-based immunotherapies. Here we report that TGF-β unexpectedly augments the cytotoxic effector activity of short-term expanded Vδ2 T cells when purified γδ T cells are activated with specific pyrophosphate antigens and IL-2 or IL-15 in the presence of TGF-β. TGF-β up-regulates the expression of CD54, CD103, interferon-γ, IL-9 and granzyme B in γδ T cells while CD56 and CD11a/CD18 are down-regulated. Moreover, we show that CD103 (αE/β7 integrin) is recruited to the immunological synapse in γδ T cells. Increased cytotoxic activity of TGF-β-exposed γδ T cells is reduced by anti-CD103 and further diminished upon additional anti-CD11a antibody treatment, pointing to a role of cellular adhesion in the enhanced cytolytic activity. Furthermore, magnetically sorted CD103-positive Vδ2 T cells exhibit superior cytolytic activity. In view of the importance of CD103 for tissue homing of lymphocytes, our results suggest that adoptive transfer of CD103-expressing Vδ2 T cells might favor their homing to solid tumors.

Keywords: CD103; IFN-gamma; TGF-beta; Vdelta2; gamma/delta T cells.


Figures

Figure 1.
Figure 1.
Cytotoxic activity of TGF-β-expanded Vδ2 T cells. Purified γδ T cells were initially activated by BrHPP and expanded in the presence of IL-2 ± TGF-β (A) or IL-15 ± TGF-β (B) or IL-15 + TGF-β ± DMSO or SB431542 (0.5 µM, 5 µM) (C). After 15 days of expansion the Vδ2 T-cell lines were restimulated with BrHPP or left untreated and then were directly added to Panc89 cells at the indicated E/T ratios (A-B) or at E/T ratio 12.5:1 (C) in a RTCA assay. Specific lysis of the target cells (Panc89) measured 4 h and 24 h after effector cell addition is depicted as mean values from 10 (A), 15 (B) or 4 (C) independent experiments with different donors. Error bars represent the SEM. Asterisks refer to significant differences according to Student´s t-test (*p ≤ 0.05; **p ≤ 0.01). E/T, effector to target ratio; medium, Vδ2 T-cell line expanded without DMSO or SB431542.
Figure 2.
Figure 2.
Degranulation determined by cell surface CD107a translocation. Purified γδ T cells were initially activated by BrHPP and expanded in the presence of IL-2 ± TGF-β (A) or IL-15 ± TGF-β (B). After 15 days of expansion, the Vδ2 T-cell lines were cultured alone or co-cultured with turmor cells (Panc89 cells; E/T, 12.5:1) with or without BrHPP-restimulation for 4h. The anti-CD107a (clone: H4A3) cell surface staining was measured by flow cytometry and is depicted as the isotype substracted mean fluorescence intensity (diff. mean FI). Depicted are the mean values of 8–12 independent experiments with different donors. Error bars represent the SEM. Asterisks refer to significant differences according to Student´s t-test (*p ≤ 0.05; **p ≤ 0.01). E/T, effector to target ratio; medium, Vδ2 T-cell line cultured without tumor cells; TC, tumor cells.
Figure 3.
Figure 3.
TGF-β-dependent modulation of soluble mediators. Purified γδ T cells were initially activated by BrHPP and expanded in the presence of and IL-2 ± TGF-β and/or IL-15 ± TGF-β. (A) Four days after inital stimulation, the amount of different mediators in cell-free culture supernatants was quantified by a bead-based muliplex assay. Median values from 3 independent experiments are depicted. (B) After 15 days of expansion, the Vδ2 T cells were activated for 6 h with TPA and Ionomycin. Monensin (3 µM) was added 4 h before fixation and subsequent intracellular staining with the specific mAb for granzyme A (clone: CB9), granzyme B (clone: GB11), IFN-γ (clone: 4S.B3), IL-9 (clone: MH9A3), perforin (clone: dG9), TNF-α (clone: 359–81-11) and the appropriate isotype controls. The differential mean fluorescence intensities were Z-normalized within each experiment. Same symbols correspond to same donors, mean values of 5–11 experiments are represented by horizontal bars. (C) Vδ2 T cells were initially activated by BrHPP and expanded in the presence of IL-15 + TGF-β. After 15 days of expansion, Vδ2 T cells were restimulated with BrHPP or were left untreated and then were directly co-cultured with Panc89 cells (E/T, 12.5:1) in a RTCA assay. IgG1 (clone: 11711.11), anti-IL-9 (clone: MH9D1), anti-IFN-γ (clone: B27) were added to the co-coculture. The quotient of the specific lysis in co-cultures treated with specific mAb relative to the specific lysis in isotype control-treated co-cultures 4 h and 24 h after effector cell addition is depicted as mean values from 8 experiments. Asterisks indicate significant differences in the specific lysis between the antibody- and isotype-treated co-cultures. Error bars represent the SEM. Asterisks refer to significant differences according to Student´s t-test (*p ≤ 0.05; **p ≤ 0.01). E/T, effector to target ratio.
Figure 4.
Figure 4.
TGF-β-dependent modulation of different adhesion molecules. Purified γδ T cells were initially activated by BrHPP and expanded in the presence of IL-2 ± TGF-β and/or IL-15 ± TGF-β. After 15 days of expansion the surface expression of the respective antigens was assessed by flow cytometry using mAb specific for CD11a (clone: HI111), CD18 (clone: 6.7), CD54 (clone: 84H10), CD56 (clone: CMSSB), CD103 (clone: Ber-ACT8) and CD106 (clone: STA). (A) The isotype corrected mean fluorescence intensity (diff. mean FI) is depicted. Same symbols correspond to same donors, mean values are represented by horizontal bars. Asterisks refer to significant differences according to Student´s t-test (*p ≤ 0.05; **p ≤ 0.01). (B) The dot plot for the specific mAb staining is depicted in dark color, the respective isotoype control in light color.
Figure 5.
Figure 5.
CD11a and CD103 contribute to the enhanced cytotoxic activity of TGF-β-expanded Vδ2 T cells. (A) The surface expression of ICAM-1 (clone: 84H10) and E-cadherin (clone: 67A4) on tumor cells (Panc89, MiaPaCa2, MCF7, Panc1) measured by flow cytometry is depicted as histograms from one representative out of 4 experiments. The specific staining is depicted in dark grey, the respective isotype control in light grey. (B-C) Purified γδ T cells were initially activated by BrHPP and expanded in the presence of IL-15 + TGF-β. After 15 days of expansion, Vδ2 T cells were added to tumor cells (E/T, 12.5:1) in a RTCA assay. (B) Before tumor cell co-culture, Vδ2 T cells were labeled for 30 min with IgG2a isotype control (clone: 20116) or anti-CD103 (clone: 2G5) and then were restimulated with BrHPP or left untreated. The percentage of specific target cell lysis 4 h and 24 h after effector cell addition is depicted as mean values from 4 (MiaPaCa2) or 5 (Panc89, MCF7, Panc1) experiments. (C) Isotype control IgG1 (clone: 11711.11) and IgG2 (clone: MG2b-57), or anti-CD11a (clone: HI111) and anti-CD103 (clone: 2G5) antibodies were directly added to the co-culture with Panc89 cells as indicated. The ratio of the specific lysis in co-cultures treated with specific mAb and the specific lysis in isotype control-treated co-cultures 4 h and 24 h after effector cell addition is depicted as mean values from at least 3 experiments. Asterisks indicate significant differences in the specific lysis between antibody-treated- and the isotype control-treated co-cultures. Error bars represent the SEM. Asterisks refer to significant differences according to Student´s t-test (*p ≤ 0.05; **p ≤ 0.01). E/T, effector to target ratio; iso, isotype control.
Figure 6.
Figure 6.
Localization of CD103 in Vδ2 T cell/target cell conjugates. Purified γδ T cells expanded in the presence of TGF-β, IL-15 and IL-2 low (10 IU/mL) were co-cultured with Panc89 cells for 45 min (E:T, 2:1). Cells were fixed, permeabilized, subsequently labeled with phalloidin and antibodies specific for CD3 (clone: UCHT1), CD103 (clone: Ber-ACT8) and E-Cadherin (clone: 67A4) and analyzed by imaging flow cytometry. (A) Two representative panels of Vδ2 [IL-2 low + IL-15 + TGF-β] T cells in a bivalent (upper panel) and a multivalent conjugate (lower panel) with Panc89 cells are depicted. (B) The percentage of the CD103-positive cells within the CD3-positive Vδ2 T cells was calculated for unconjugated, total and CD3-positive cells in bivalent conjugates (synapse). Mean values of 3 experiments are shown. (C) On CD103-positive Vδ2 T cells the intensity (fluorescence intensity) and the bright detail intensity (BDI) were analyzed on unconjugated, total or Vδ2 T cells in a bivalent conjugate. Mean values of 4 independent experiments and the SEM are shown.
Figure 7.
Figure 7.
Functional characterization of CD103 sorted Vδ2 T-cell populations. Purified γδ T cells were initially activated by BrHPP and expanded in the presence of IL-15 ± TGF-β. After 12 days of expansion, the Vδ2 [IL-15 + TGF-β] T cells were magnetically sorted according to their CD103 surface expression and cultured for 3 more days. After a total of 15 days of expansion the Vδ2 T-cell lines were restimulated with BrHPP or left untreated and then were directly added to Panc89 cells at the E/T ratio 2:1 (A) or 12.5:1 (B-C). (A) The stability of the immunological synapse was analysed using a detachment assay. The amount of remaining conjugates was determined by flow cytomety after PFA-fixation at indicated time points and is depicted as mean values from 5 independent experiments with different donors. (B) After 4 h of co-culture the anti-CD107a (clone: H4A3) cell surface staining was measured by flow cytometry and is depicted as the isotype corrected percentage of CD107a-positive cells. Mean values from 4 (CD103 populations magnetically sorted) or 6 (FACS-gated on CD103 populations within Vδ2 [IL-15 + TGF-β] T-cell line) independent experiments with different donors are shown. (C) The specific lysis of the target cells (Panc89) measured by RTCA 4 h after effector cell addition is depicted as mean values from 7 independent experiments with different donors. Error bars represent the SEM. Asterisks refer to significant differences according to Student´s t-test (*p ≤ 0.05; **p ≤ 0.01). E/T, effector to target ratio; medium, Vδ2 T-cell line cultured without tumor cells; TC, tumor cells.

Similar articles

Cited by

References

    1. Gu S, Nawrocka W, Adams EJ.. Sensing of pyrophosphate metabolites by Vgamma9Vdelta2 T cells. Front Immunol. 2014;5:688 PMID:25657647. doi:10.3389/fimmu.2014.00688. - DOI - PMC - PubMed
    1. Buccheri S, Guggino G, Caccamo N, Li DP, Dieli F. Efficacy and safety of gammadeltaT cell-based tumor immunotherapy: a meta-analysis. J Biol Regul Homeost Agents. 2014;28:81–90. PMID: 24750794. - PubMed
    1. Helm O, Mennrich R, Petrick D, Goebel L, Freitag-Wolf S, Röder C, Kalthoff H, Röcken C, Sipos B, Kabelitz D, et al. Comparative characterization of stroma cells and ductal epithelium in chronic pancreatitis and pancreatic ductal adenocarcinoma. PLoS One. 2014;9:e94357 PMID:24797069. doi:10.1371/journal.pone.0094357. - DOI - PMC - PubMed
    1. Oberg HH, Grage-Griebenow E, Adam-Klages S, Jerg E, Peipp M, Kellner C, Petrick D, Gonnermann D, Freitag-Wolf S, Röcken C, et al. Monitoring and functional characterization of the lymphocytic compartment in pancreatic ductal adenocarcinoma patients. Pancreatology. 2016;16:1069–1079. PMID:27424476. doi:10.1016/j.pan.2016.07.008. - DOI - PubMed
    1. Daley D, Zambirinis CP, Seifert L, Akkad N, Mohan N, Werba G, Barilla R, Torres-Hernandez A, Hundeyin M, Mani VRK, et al. gammadelta T cells support pancreatic oncogenesis by restraining alphabeta T cell activation. Cell. 2016;166:1485–1499. PMID:27569912. doi:10.1016/j.cell.2016.07.046. - DOI - PMC - PubMed

Publication types