

Data on retinoic acid and reduced serum concentration induced differentiation of Neuro-2a neuroblastoma cells
- PMID: 30547071
- PMCID: PMC6282191
- DOI: 10.1016/j.dib.2018.11.097
Data on retinoic acid and reduced serum concentration induced differentiation of Neuro-2a neuroblastoma cells
Abstract
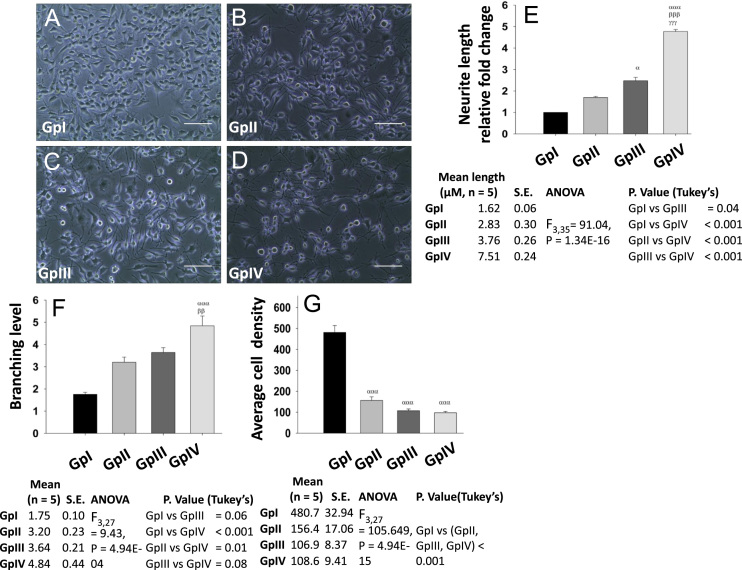
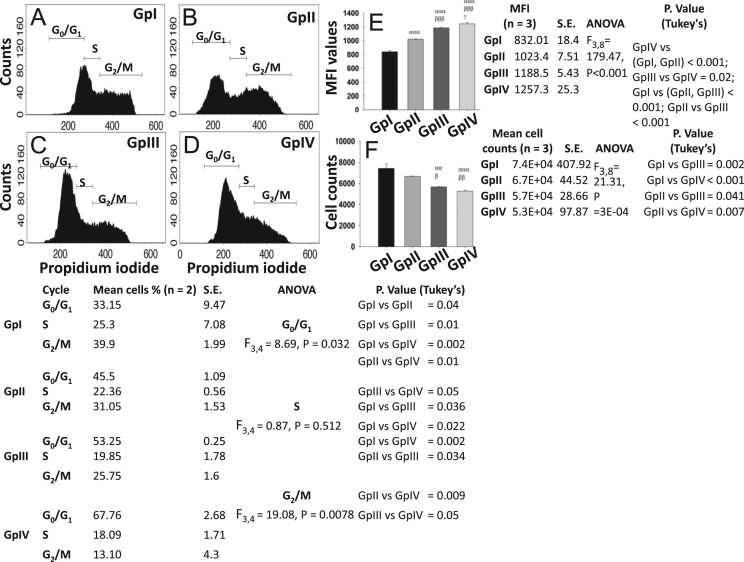
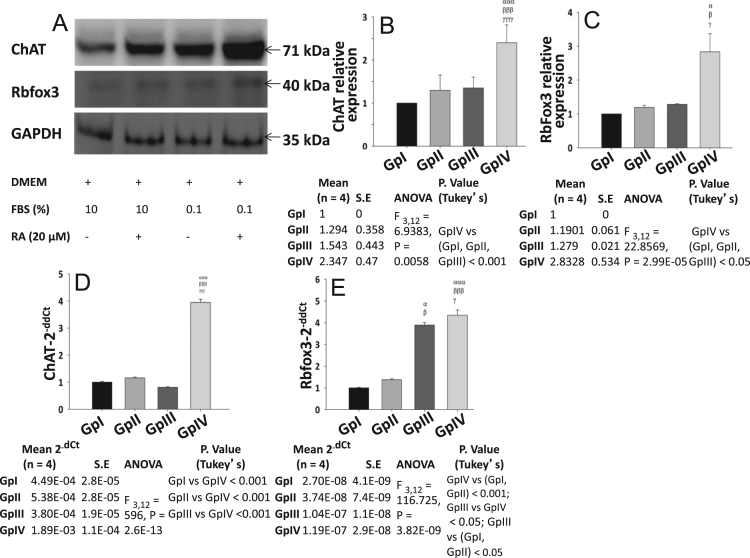
The present data describe the relative neuro-2a cellular differentiation induced by reducing serum concentration (0.1% FBS) in DMEM in the presence/absence of 20 μM retinoic acid (RA). Neurite outgrowth was observed within 24 h in DMEM supplemented with reduced serum and retinoic acid (GpIV). The CFSE based proliferation assay data signified cessation of neuro-2a cellular proliferation in GpIV. An increase in the number of cells arrested at G0/G1 phase was also evident in GpIV and DMEM supplemented with 0.1% FBS (GpIII). Moreover, GpIV cells had improved mRNA and protein expression of Rbfox3/NeuN and choline acetyltransferase (ChAT).
Keywords: Neuro-2a; Reduced serum; Retinoic acid.
Figures
Similar articles
-
Role of miR-124 in the regulation of retinoic acid-induced Neuro-2A cell differentiation.Neural Regen Res. 2020 Jun;15(6):1133-1139. doi: 10.4103/1673-5374.270417. Neural Regen Res. 2020. PMID: 31823894 Free PMC article.
-
Functional decreases in P2X7 receptors are associated with retinoic acid-induced neuronal differentiation of Neuro-2a neuroblastoma cells.Cell Signal. 2009 Jun;21(6):881-91. doi: 10.1016/j.cellsig.2009.01.036. Cell Signal. 2009. PMID: 19385050
-
Diacylglycerol kinase ζ generates dipalmitoyl-phosphatidic acid species during neuroblastoma cell differentiation.Biochem Biophys Rep. 2016 Oct 15;8:352-359. doi: 10.1016/j.bbrep.2016.10.004. eCollection 2016 Dec. Biochem Biophys Rep. 2016. PMID: 28955976 Free PMC article.
-
Cholinergic differentiation triggered by blocking cell proliferation and treatment with all-trans-retinoic acid.Brain Res. 2000 Aug 25;874(2):178-85. doi: 10.1016/s0006-8993(00)02575-0. Brain Res. 2000. PMID: 10960602
-
On the use of neuro-2a neuroblastoma cells versus intact neurons in primary culture for neurotoxicity studies.Crit Rev Neurobiol. 2005;17(1):27-50. doi: 10.1615/critrevneurobiol.v17.i1.20. Crit Rev Neurobiol. 2005. PMID: 16307526 Review.
Cited by
-
Ethanolic Fruit Extract of Emblica officinalis Suppresses Neuroinflammation in Microglia and Promotes Neurite Outgrowth in Neuro2a Cells.Evid Based Complement Alternat Med. 2021 Sep 7;2021:6405987. doi: 10.1155/2021/6405987. eCollection 2021. Evid Based Complement Alternat Med. 2021. PMID: 34539802 Free PMC article.
-
Time dependent changes in protein expression induced by intermittent theta burst stimulation in a cell line.Front Neurol. 2024 Oct 28;15:1396776. doi: 10.3389/fneur.2024.1396776. eCollection 2024. Front Neurol. 2024. PMID: 39529622 Free PMC article.
-
The Combination of Citicoline and Nicotinamide Mononucleotide Induces Neurite Outgrowth and Mitigates Vascular Cognitive Impairment via SIRT1/CREB Pathway.Cell Mol Neurobiol. 2023 Nov;43(8):4261-4277. doi: 10.1007/s10571-023-01416-7. Epub 2023 Oct 9. Cell Mol Neurobiol. 2023. PMID: 37812361 Free PMC article.
-
Cockayne Syndrome Linked to Elevated R-Loops Induced by Stalled RNA Polymerase II during Transcription Elongation.Nat Commun. 2024 Jul 17;15(1):6031. doi: 10.1038/s41467-024-50298-w. Nat Commun. 2024. PMID: 39019869 Free PMC article.
-
Anacardium Occidentale L. Leaf Extracts Protect Against Glutamate/H2O2-Induced Oxidative Toxicity and Induce Neurite Outgrowth: The Involvement of SIRT1/Nrf2 Signaling Pathway and Teneurin 4 Transmembrane Protein.Front Pharmacol. 2021 Apr 23;12:627738. doi: 10.3389/fphar.2021.627738. eCollection 2021. Front Pharmacol. 2021. PMID: 33995025 Free PMC article.
References
-
- Longair M.H., Baker D.A., Armstrong J.D. Simple neurite tracer: open source software for reconstruction, visualization and analysis of neuronal processes. Bioinformatics. 2011;27:2453–2454. - PubMed
-
- Crowley L.C., Chojnowski G., Waterhouse N.J. Measuring the DNA content of cells in apoptosis and at different cell-cycle stages by propidium iodide staining and flow cytometry. Cold Spring Harb. Protoc. 2016;(2016) - PubMed
LinkOut - more resources
Full Text Sources
