

Design, Validation, and Application of an Enzyme-Coupled Hydrogen Sulfide Detection Assay
- PMID: 30547566
- PMCID: PMC6526949
- DOI: 10.1021/acs.biochem.8b01083
Design, Validation, and Application of an Enzyme-Coupled Hydrogen Sulfide Detection Assay
Abstract
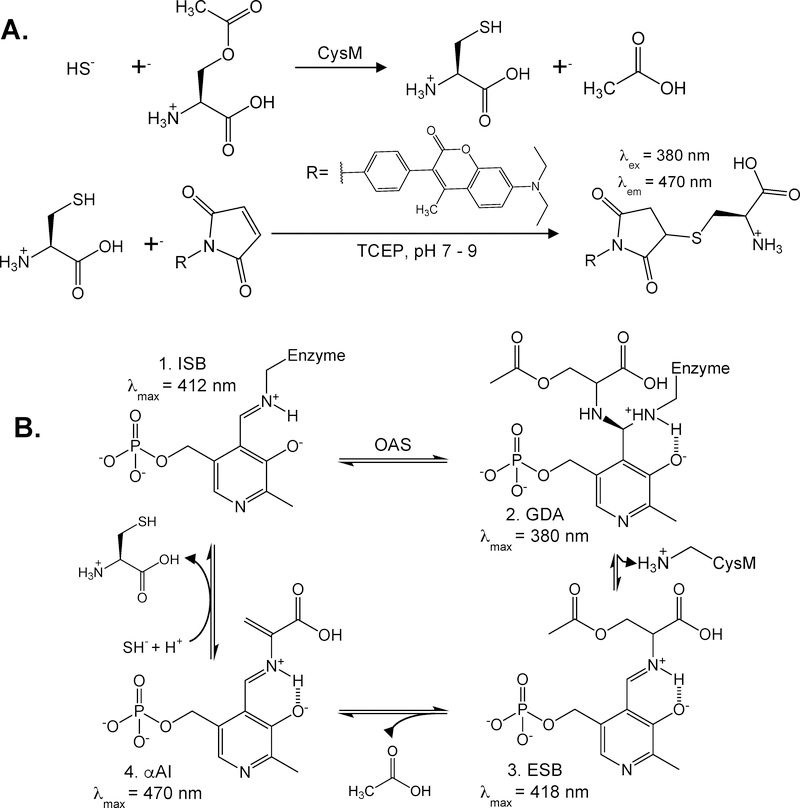
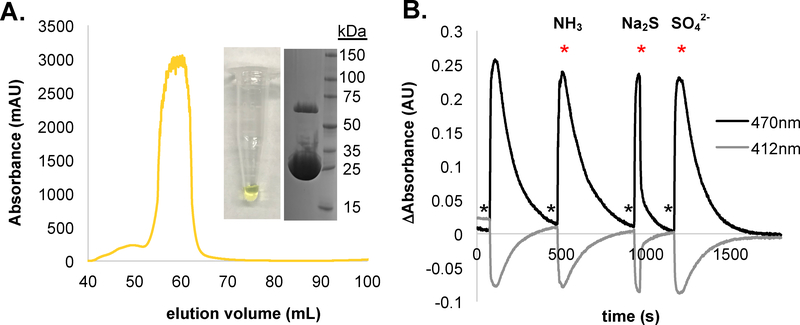
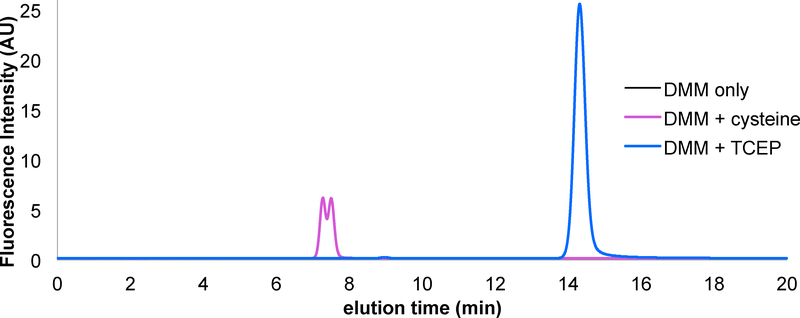
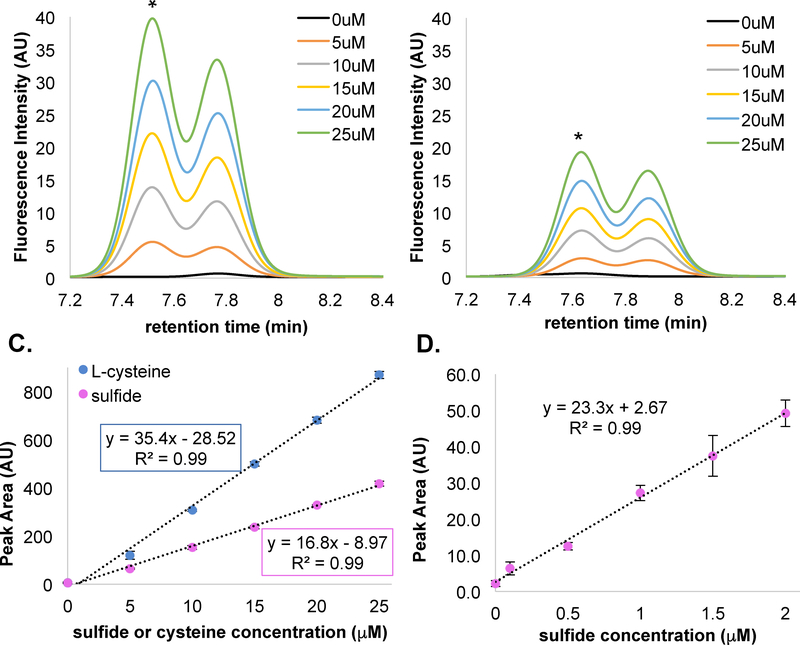
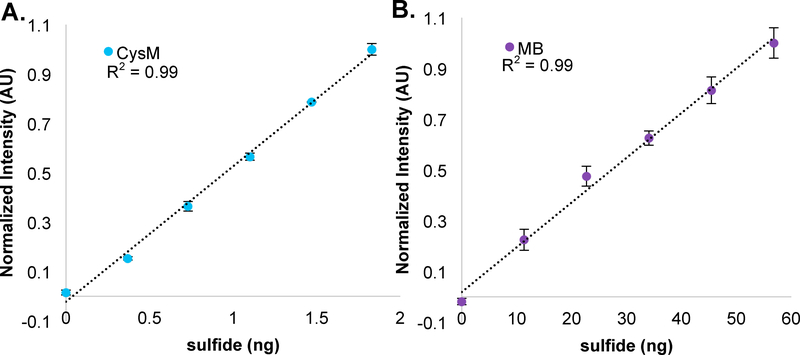
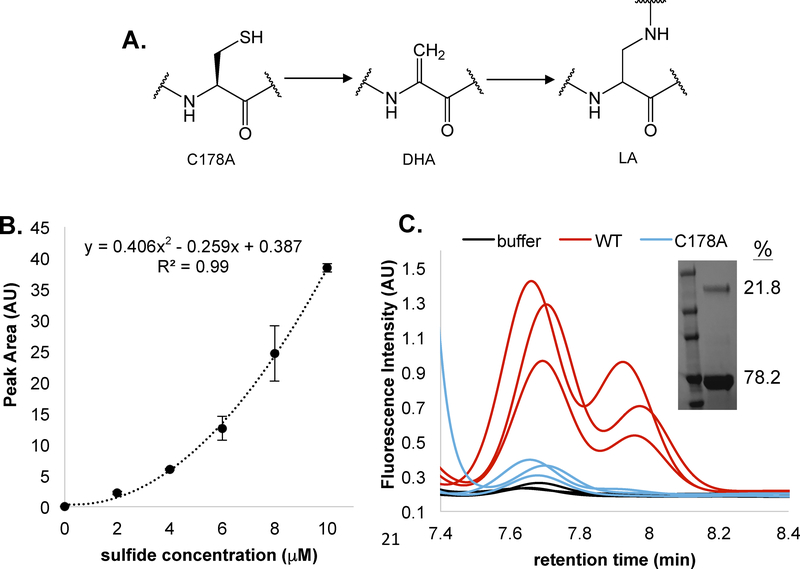
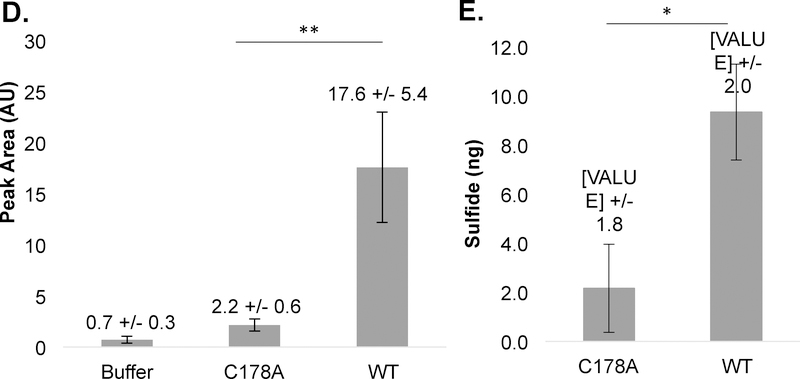
Hydrogen sulfide (H2S) is a key metabolite in biosynthesis and is increasingly being recognized as an essential gasotransmitter. Owing to its diffusible and reactive nature, H2S can be difficult to quantify, particularly in situ. Although several detection schemes are available, they have drawbacks. In efforts to quantify sulfide release in the cross-linking reaction of the flagellar protein FlgE, we developed an enzyme-coupled sulfide detection assay using the Escherichia coli O-acetylserine sulfhydrylase enzyme CysM. Conversion of HS- to l-cysteine via CysM followed by derivatization with the thiol-specific fluorescent dye 7-diethylamino-3-(4-maleimidophenyl)-4-methylcoumarin enables for facile detection and quantification of H2S by fluorescent HPLC. The assay was validated by comparison to the well-established methylene blue sulfide detection assay and the robustness demonstrated by interference assays in the presence of common thiols such as glutathione, 2-mercaptoethanol, dithiothreitol, and l-methionine, as well as a range of anions. We then applied the assay to the aforementioned lysinoalanine cross-linking by the Treponema denticola flagellar hook protein FlgE. Overall, unlike previously reported H2S detection methods, the assay provides a biologically compatible platform to accurately and specifically measure hydrogen sulfide in situ, even when it is produced on long time scales.
Conflict of interest statement
Notes - The authors declare no competing financial interest
Figures
Similar articles
-
Multiple enzymes can make hydrogen sulfide from cysteine in Treponema denticola.Anaerobe. 2020 Aug;64:102231. doi: 10.1016/j.anaerobe.2020.102231. Epub 2020 Jun 27. Anaerobe. 2020. PMID: 32603680 Free PMC article.
-
Quantitative and comparative liquid chromatography-electrospray ionization-mass spectrometry analyses of hydrogen sulfide and thiol metabolites derivaitized with 2-iodoacetanilide isotopologues.J Chromatogr A. 2018 Jun 1;1552:43-52. doi: 10.1016/j.chroma.2018.04.008. Epub 2018 Apr 5. J Chromatogr A. 2018. PMID: 29650481
-
Fluorescent detection of hydrogen sulfide (H2S) through the formation of pyrene excimers enhances H2S quantification in biochemical systems.J Biol Chem. 2022 Oct;298(10):102402. doi: 10.1016/j.jbc.2022.102402. Epub 2022 Aug 19. J Biol Chem. 2022. PMID: 35988644 Free PMC article.
-
Recent advances in thiol and sulfide reactive probes.J Cell Biochem. 2014 Jun;115(6):1007-22. doi: 10.1002/jcb.24762. J Cell Biochem. 2014. PMID: 24415273 Review.
-
Hydrogen sulfide in plants: from dissipation of excess sulfur to signaling molecule.Nitric Oxide. 2014 Sep 15;41:72-8. doi: 10.1016/j.niox.2014.02.005. Epub 2014 Feb 26. Nitric Oxide. 2014. PMID: 24582856 Review.
Cited by
-
An Enzymatic Oxidation Cascade Converts δ-Thiolactone Anthracene to Anthraquinone in the Biosynthesis of Anthraquinone-Fused Enediynes.JACS Au. 2024 Aug 9;4(8):2925-2935. doi: 10.1021/jacsau.4c00279. eCollection 2024 Aug 26. JACS Au. 2024. PMID: 39211597 Free PMC article.
-
Lysinoalanine cross-linking is a conserved post-translational modification in the spirochete flagellar hook.PNAS Nexus. 2023 Oct 26;2(12):pgad349. doi: 10.1093/pnasnexus/pgad349. eCollection 2023 Dec. PNAS Nexus. 2023. PMID: 38047041 Free PMC article.
-
Structure and chemistry of lysinoalanine crosslinking in the spirochaete flagella hook.Nat Chem Biol. 2019 Oct;15(10):959-965. doi: 10.1038/s41589-019-0341-3. Epub 2019 Aug 12. Nat Chem Biol. 2019. PMID: 31406373 Free PMC article.
-
Signaling Paradigms of H2S-Induced Vasodilation: A Comprehensive Review.Antioxidants (Basel). 2024 Sep 25;13(10):1158. doi: 10.3390/antiox13101158. Antioxidants (Basel). 2024. PMID: 39456412 Free PMC article. Review.
-
The effects of intravitreal H2 S application on apoptosis in the retina and cornea in experimental glaucoma model.Int J Exp Pathol. 2019 Oct;100(5-6):330-336. doi: 10.1111/iep.12334. Epub 2019 Nov 27. Int J Exp Pathol. 2019. PMID: 31777145 Free PMC article.
References
-
- Wang R (2002) Two’s company, three’s a crowd: can H2S be the third endogenous gaseous transmitter? FASEB J. 16, 1792–1798. - PubMed
-
- Wallace JL, and Wang R (2015) Hydrogen sulfide-based therapeutics: exploiting a unique but ubiquitous gasotransmitter. Nat. Rev. | DRUG Discov 14, 329–345. - PubMed
-
- Göte H, and Alexander J (1963) Oxidation rate of sulfide in sea water, A preliminary study. J. Geophys. Res 68, 3995–3997.
Publication types
MeSH terms
Substances
Grants and funding
LinkOut - more resources
Full Text Sources
Molecular Biology Databases
