. 2018 Dec 14;37(1):314.
doi: 10.1186/s13046-018-0988-8.

Epigenetic reprogramming of epithelial mesenchymal transition in triple negative breast cancer cells with DNA methyltransferase and histone deacetylase inhibitors

Affiliations

Epigenetic reprogramming of epithelial mesenchymal transition in triple negative breast cancer cells with DNA methyltransferase and histone deacetylase inhibitors

Yanrong Su et al. J Exp Clin Cancer Res. .

Abstract

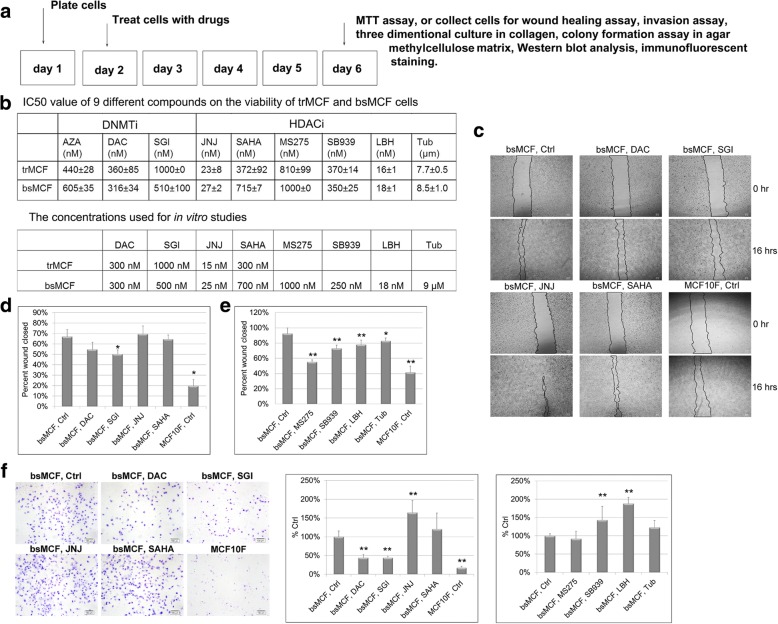
Background: Triple negative breast cancer (TNBC) is an aggressive neoplasia with no effective therapy. Our laboratory has developed a unique TNBC cell model presenting epithelial mesenchymal transition (EMT) a process known to be important for tumor progression and metastasis. There is increasing evidence showing that epigenetic mechanisms are involved in the activation of EMT. The objective of this study is to epigenetically reverse the process of EMT in TNBC by using DNA methyltransferase inhibitors (DNMTi) and histone deacetylase inhibitors (HDACi).

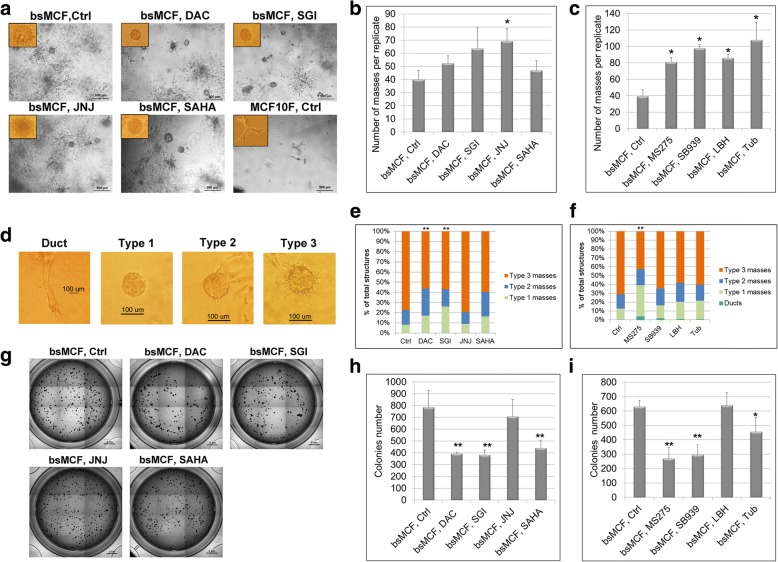
Methods: We evaluated the antitumor effect of three DNMTi and six HDACi using our TNBC cell model by MTT assay, migration and invasion assay, three dimensional culture, and colony formation assay. We then performed the combined treatment both in vitro and in vivo using the most potent DNMTi and HDACi, and tested the combined treatment in a panel of breast cancer cell lines. We investigated changes of EMT markers and potential signaling pathways associated with the antitumor effects.

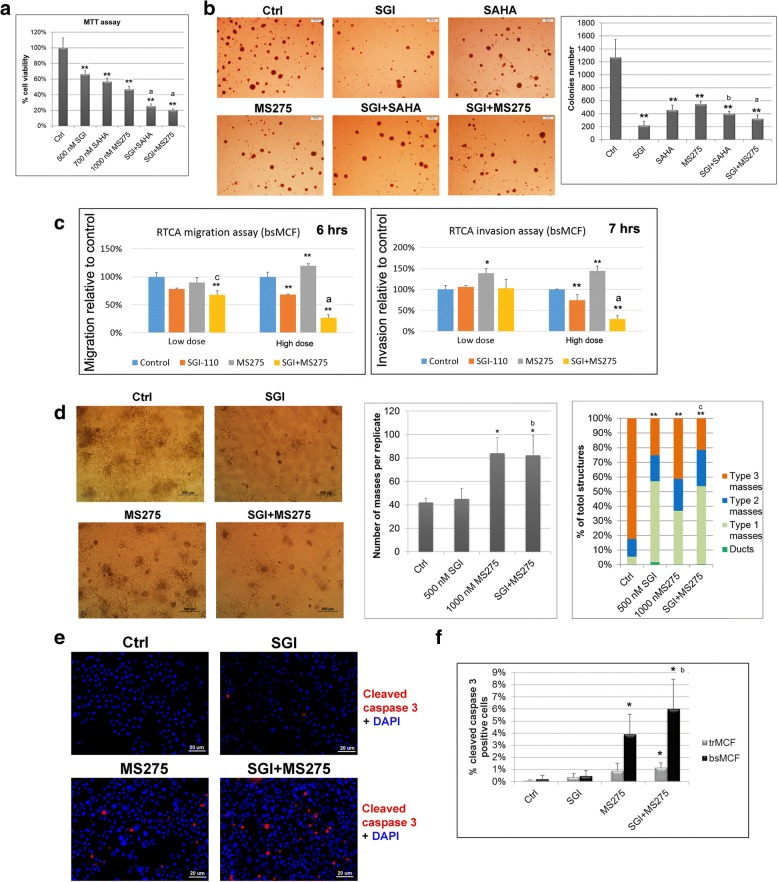
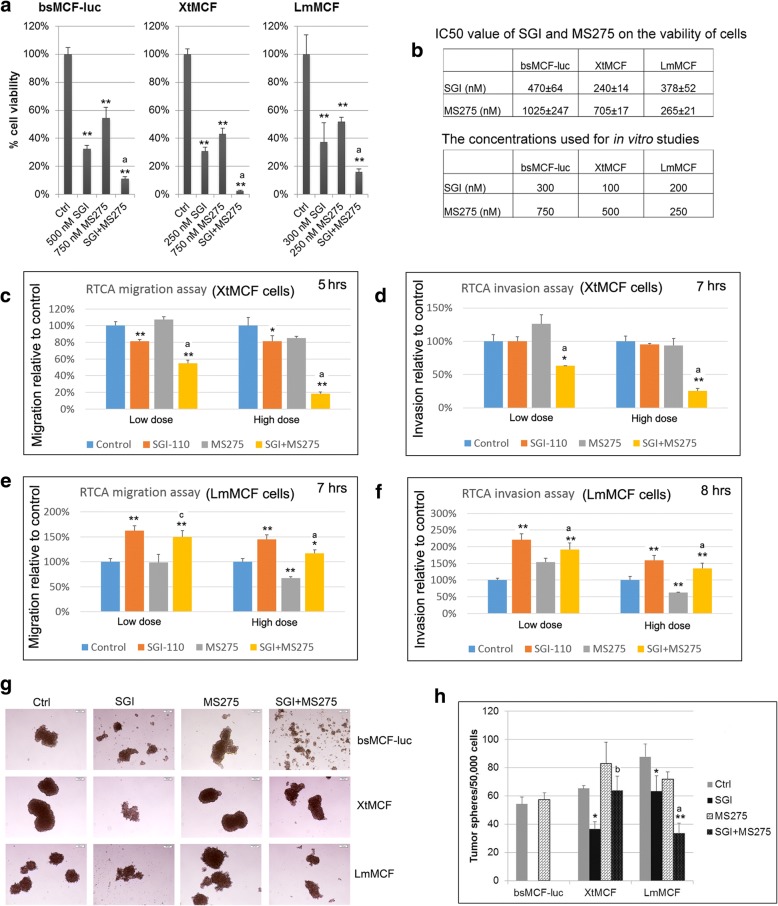
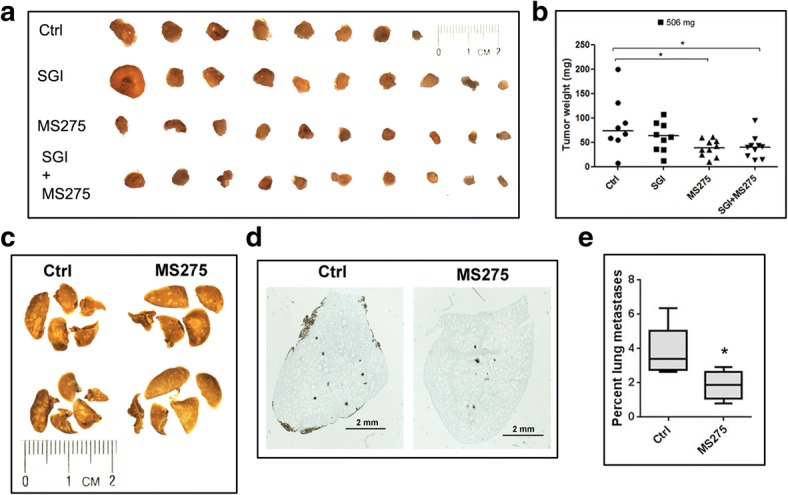
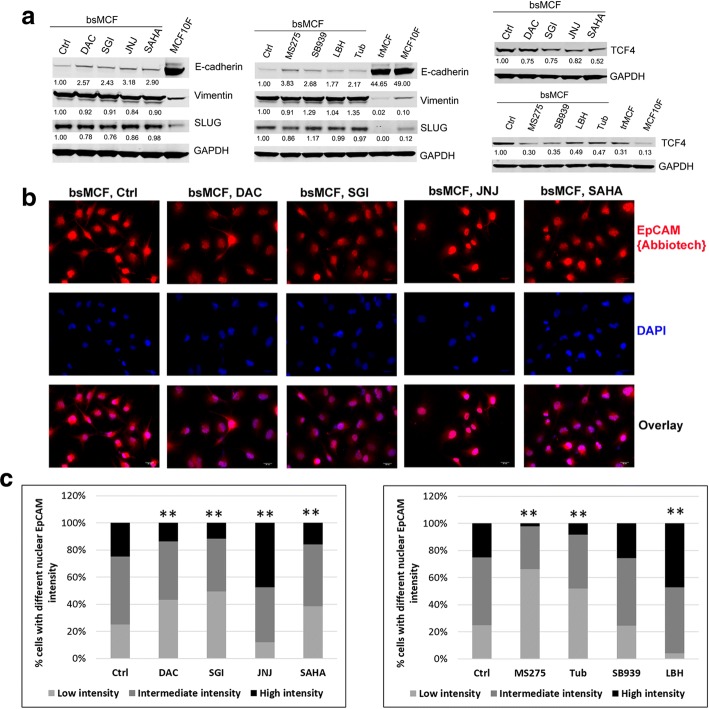
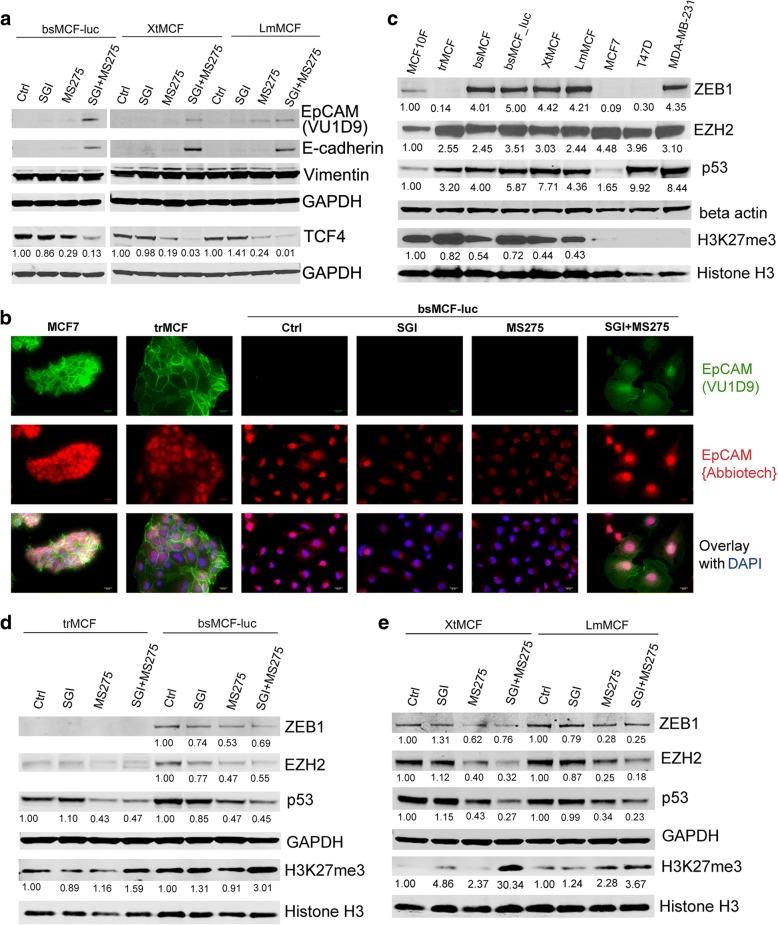
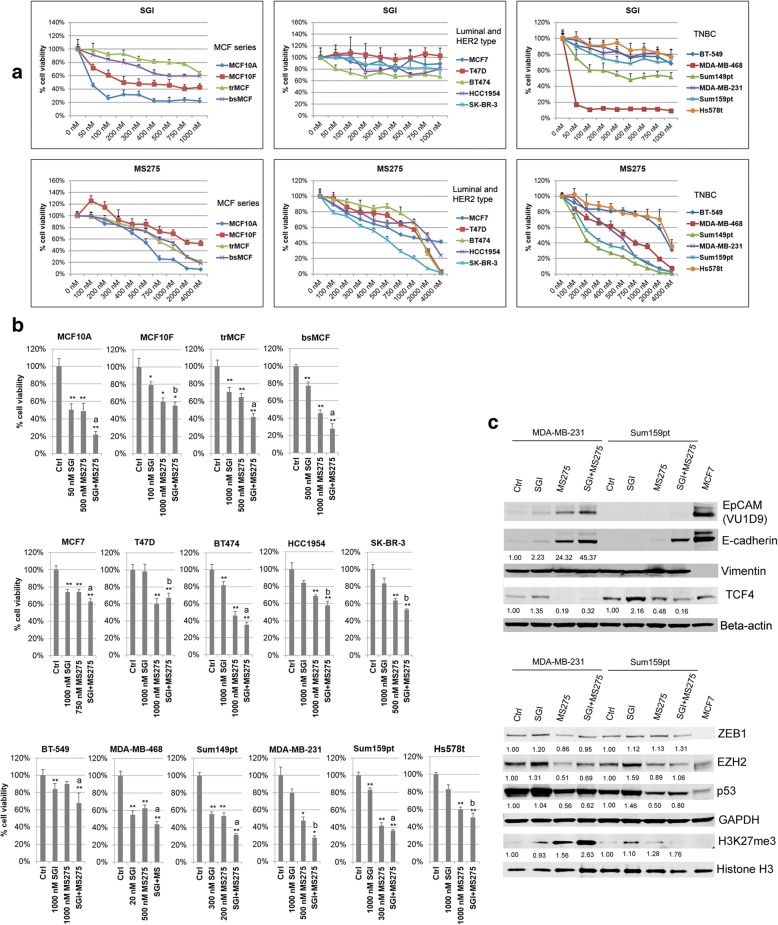
Results: We showed that DNMTi and HDACi can reprogram highly aggressive TNBC cells that have undergone EMT to a less aggressive phenotype. SGI-110 and MS275 are superior to other seven compounds being tested. The combination of SGI with MS275 exerts a greater effect than single agent alone in inhibiting cell proliferation, motility, colony formation, and stemness of cancer cells. We also demonstrated that MS275 and the combination of SGI with MS275 exert in vivo antitumor effect. We revealed that the combined treatment synergistically reverses EMT through inhibiting EpCAM cleavage and WNT signaling, suppressing mutant p53, ZEB1, and EZH2, and inducing E-cadherin, apoptosis, as well as histone H3 tri-methylation.

Conclusions: Our study showed that DNMTi and HDACi exert antitumor activity in TNBC cells partially by epigenetically reprograming EMT. Our findings strongly suggest that TNBC is sensitive to epigenetic therapies. Therefore, we propose a new strategy to treat TNBC by using the combination of SGI-110 with MS275, which exerts superior antitumor effects by simultaneously targeting multiple pathways.

Keywords: DNA methyltransferase; Epithelial mesenchymal transition; Histone deacetylase; Triple negative breast cancer.


Conflict of interest statement

Ethics approval and consent to participate

Animal studies were conducted in the laboratory animal facility at Fox Chase Cancer Center using protocol approved by the IACUC committee.

Consent for publication

Not applicable.

Competing interests

The authors declare that they have no competing interests.

Publisher’s Note

Springer Nature remains neutral with regard to jurisdictional claims in published maps and institutional affiliations.

Figures

Fig. 1
Fig. 1
DNMTi and HDACi treatment inhibit proliferation, migration, and invasion of TNBC cells. a Schematic representation of the cell treatment for in vitro phenotypic studies. b Tables show the IC50 of the compounds and the concentrations used for in vitro assays. c Representative images of wound healing assay. Magnification, 40×. Scale bar, 60 μm. d-e Quantification of wound healing assay. f Representative images of Matrigel invasion assay and quantification of the invaded cells. Scale bar, 100 μm. (40×). *indicates p < 0.05, **indicates p < 0.01 compared to control. All experiments were repeated at least twice and one representative experiment is shown in the figure. This also applies to the experiments shown in other figures
Fig. 2
Fig. 2
DNMTi and HDACi reverse bsMCF cells malignant behavior in collagen and inhibit colony formation. a Representative images of 3D culture in bovine type I collagen. Images of structures formed in collagen were acquired after 6 days of culture. Magnification, 40×. Scale bar, 500 μm. b-c Quantification of the number of masses formed in collagen. d Classification of the masses. Type 1 masses show smooth outer surface and no protrusions present; type 2 masses show rough outer surface with 1–5 protrusions; type 3 masses show large amount of protrusions (> 5), indicate more invasive phenotype. Magnification, 40× for duct, and 100× for type 1–3 masses. e-f Quantification of the types of the masses. DAC, SGI, and MS275 treatment increase the number of masses with fewer protrusions. g Representative images of colony formation in agar methylcellulose matrix. Images were acquired after 9 days of culture. Magnification, 2×. Scale bar, 2 mm. h-i Quantification of the number of the colonies formed in methylcellulose matrix. *indicates p < 0.05. ** indicates p < 0.01 compared to control
Fig. 3
Fig. 3
Combined treatment of DNMTi with HDACi is more effective in bsMCF cells. a Combined treatment of SGI with SAHA or MS275 induces greater inhibition in cell proliferation. b Colony formation in agar methylcellulose and quantification of colonies number. Magnification, 20×. Scale bar, 200 μm. c Quantification graphs at the time point of 6 h for cell migration, and 7 h for invasion by RTCA assay. Cells were first treated and then viable cells were used for both migration and invasion assay. d Representative images of 3D culture in collagen, and quantification of the number and types of masses formed by bsMCF cells. Magnification, 40×. Scale bar, 500 μm. e Representative images of cell apoptosis by immunofluorescence. bsMCF cells were treated with indicated agents, four days later, both floating and adherent cells were collected and cytospun on glass slides. Cells were fixed and stained with cleaved caspase 3 antibody. Magnification, 200×. Scale bar, 20 μm. f Quantification of cell apoptosis. The symbols used for indicating statistical results are as follows: * indicates p < 0.05 when compared to control. ** indicates p < 0.01 when compared to control. a indicates p < 0.01 when compared the combined treatment with single agent. b indicates p < 0.05 when compared the combined treatment with SGI. c indicates p < 0.05 when compared the combined treatment with MS275. This rule applies to other figures too
Fig. 4
Fig. 4
Effects of SGI, MS275, or the combined treatment in bsMCF-luc, XtMCF, and LmMCF cell lines. a Combined treatment of SGI with MS275 significantly inhibits cell growth when compared with the single agent examined by MTT assay. b Tables show the IC50 of SGI and MS275, and the concentrations used for in vitro studies. c, e Quantification graphs for RTCA cell migration assay. d, f Quantification graphs for RTCA cell invasion assay. g Representative images of tumorspheres. Magnification, 40×. Scale bar, 100 μm. h Quantification of tumorshperes number. The tumorspheres formed by bsMCF-luc cells after the treatment with SGI or the combination were dissociated automatically and not counted
Fig. 5
Fig. 5
MS275, or the combination of SGI with MS275 suppress TNBC growth or metastasis. a 5 × 104 XtMCF cells were injected to the mammary fat pad of 8–9 weeks old female CB17/SCID mice. Three days after cells injection, mice were treated with indicted compounds for three weeks. Mice were sacrificed 31 days post cells injection. Images of XtMCF xenografts are shown. Magnification, 6.3×. b Dot plot shows the tumor weight at sacrifice, the line in each group indicates the median value. c 8 × 104 LmMCF cells were injected into the tail vein of 8–9 weeks old female CB17/SCID mice. Six days after cells injection, mice were treated with vehicle control or MS275 once a week for three weeks. Mice were sacrificed 25 days post cells injection. Representative images of lungs fixed with Bouin’s solution show lung metastases on lung surface. Magnification, 8×. d Immunohistochemical staining to vimentin on lung sections show metastases of LmMCF cells in the lungs. Scale bar, 2 mm. e Quantification of the ratio of metastatic area to the whole lungs shows MS275 treatment inhibiting lung metastases of LmMCF cells
Fig. 6
Fig. 6
Treatment of DNMTi and HDACi reprogram EMT partially mediated by EpCAM and WNT signaling. a Western blotting show up-regulation of E-cadherin and down-regulation of TCF4 by the treatment of DNMTi and HDACi. The number below the band indicates the relative expression level to the control quantified by Ly-Cor Odyssey software. b Representative images of immunofluorescence staining of EpCAM. Magnification, 400×. Scale bar, 20 μm. c Quantification of nuclear EpCAM shows reduced nuclear EpCAM intensity in the cells treated with DAC, SGI, SAHA, MS275, and Tub, whereas an increased intensity was observed in the cells treated with JNJ and LBH
Fig. 7
Fig. 7
The combination of SGI with MS275 suppresses WNT and mutant p53 pathways, up-regulates H3K27me3. a WB analyses show up-regulation of E-cadherin and full length EpCAM, and down-regulation of TCF4 in TNBC cells. b Immunofluorescence images show presence of EpCAM containing N-terminal EGF domain indicated by staining with EpCAM(VU1D9) antibody in bsMCF-luc cells after the combined treatment. Magnification, 400×. Scale bar, 20 μm. c, d and e WB analyses of mutant p53, ZEB1, EZH2, and H3K27me3. Beta actin and GAPDH were used as loading control
Fig. 8
Fig. 8
TNBC cell lines are sensitive to the combined treatment of SGI with MS275. a Dose response curve of breast epithelial/cancer cell lines to the treatment of SGI and MS275 by MTT assay. b The effect of SGI, MS275, or the combination treatment on the growth of breast epithelial/cancer cell lines. c Western blotting show inhibition of WNT and mutant p53 signaling pathways, and up-regulation of H3K27me3

References

    1. Gluz O, Liedtke C, Gottschalk N, Pusztai L, Nitz U, Harbeck N. Triple-negative breast cancer--current status and future directions. Annals of oncology : official journal of the European Society for Medical Oncology / ESMO. 2009;20(12):1913–1927. - PubMed
    1. Blows FM, Driver KE, Schmidt MK, Broeks A, van Leeuwen FE, Wesseling J, et al. Subtyping of breast cancer by immunohistochemistry to investigate a relationship between subtype and short and long term survival: a collaborative analysis of data for 10,159 cases from 12 studies. PLoS Med. 2010;7(5):e1000279. - PMC - PubMed
    1. Masuda H, Baggerly KA, Wang Y, Zhang Y, Gonzalez-Angulo AM, Meric-Bernstam F, et al. Differential response to neoadjuvant chemotherapy among 7 triple-negative breast cancer molecular subtypes. Clin Cancer Res. 2013;19(19):5533–5540. - PMC - PubMed
    1. Andre F, Zielinski CC. Optimal strategies for the treatment of metastatic triple-negative breast cancer with currently approved agents. Ann Oncol. 2012;23(Suppl 6):vi46–vi51. - PubMed
    1. Fallahpour S, Navaneelan T, De P, Borgo A. Breast cancer survival by molecular subtype: a population-based analysis of cancer registry data. CMAJ open. 2017;5(3):E734–E7e9. - PMC - PubMed

MeSH terms

Substances