Review
. 2019 May;11(3):e1443.
doi: 10.1002/wsbm.1443. Epub 2018 Dec 12.

Integrating molecular networks with genetic variant interpretation for precision medicine

Affiliations
Review

Integrating molecular networks with genetic variant interpretation for precision medicine

Emidio Capriotti et al. Wiley Interdiscip Rev Syst Biol Med. 2019 May.

Abstract

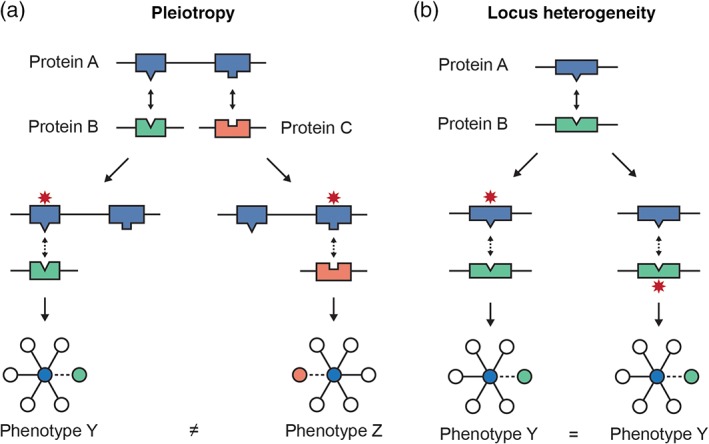
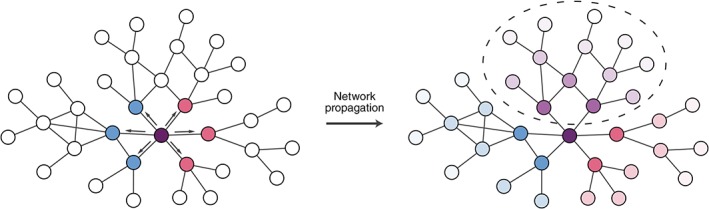
More reliable and cheaper sequencing technologies have revealed the vast mutational landscapes characteristic of many phenotypes. The analysis of such genetic variants has led to successful identification of altered proteins underlying many Mendelian disorders. Nevertheless the simple one-variant one-phenotype model valid for many monogenic diseases does not capture the complexity of polygenic traits and disorders. Although experimental and computational approaches have improved detection of functionally deleterious variants and important interactions between gene products, the development of comprehensive models relating genotype and phenotypes remains a challenge in the field of genomic medicine. In this context, a new view of the pathologic state as significant perturbation of the network of interactions between biomolecules is crucial for the identification of biochemical pathways associated with complex phenotypes. Seminal studies in systems biology combined the analysis of genetic variation with protein-protein interaction networks to demonstrate that even as biological systems evolve to be robust to genetic variation, their topologies create disease vulnerabilities. More recent analyses model the impact of genetic variants as changes to the "wiring" of the interactome to better capture heterogeneity in genotype-phenotype relationships. These studies lay the foundation for using networks to predict variant effects at scale using machine-learning or algorithmic approaches. A wealth of databases and resources for the annotation of genotype-phenotype relationships have been developed to support developments in this area. This overview describes how study of the molecular interactome has generated insights linking the organization of biological systems to disease mechanism, and how this information can enable precision medicine. This article is categorized under: Translational, Genomic, and Systems Medicine > Translational Medicine Biological Mechanisms > Cell Signaling Models of Systems Properties and Processes > Mechanistic Models Analytical and Computational Methods > Computational Methods.

Keywords: disease mechanism; genetic disease; network analysis; variant interpretation.


Conflict of interest statement

The authors have declared no conflicts of interest for this article.

Figures

Figure 1
Figure 1
Network analysis measures. PPI network of the NTRK2 activation pathway through FRS2/FRS3. (a) The degree (k) is the number of edges of a node. The degree of FRS2 is 8. The edges are highlighted in red. (b) The clustering coefficient C of a node is calculated as the ratio between the connected triangles (delimited by the solid red and gray lines) and the total number of possible triangles k × (k − 1). The dashed lines represent the unbound triangles. For FRS2, C is 0.75 (21/28). (c) The degree centrality (C D) of a node is the number of edges divided by the total number of possible edges. The C D of FRS2 is 0.8 (8/10). Red dotted lines represent the missing edges. (d) The betweenness centrality (B) is the sum over all the possible pairs of the fraction of shortest path passing through a node (red) divided by the total number of shortest paths. B of FRS2 is 9.167 (18 × 0.5 + 0.167). Gray edges are part of the shortest paths not passing through FRS2. In this example, edge length is determined by the layout algorithm and does not have a quantitative interpretation
Figure 2
Figure 2
Exploring network topology as a determinant of gene–phenotype relationships. Topological location within the network has implications for biological function. (a) Nodes can be described with respect to particular characteristics in the network, including high degree hubs (red), nodes at the periphery (yellow) and nodes with the highest centrality according to four popular measures of centrality. We calculated network measures including (b) degree and (c) betweenness centrality for four groups of genes: 1,371 essential genes (Hart et al., 2015), 125 cancer genes (Vogelstein et al., 2013), 2,921 Mendelian disease genes (Stenson et al., 2017), and 7,099 other genes based on the latest release of STRING (Szklarczyk et al., 2017) to illustrate the types of observation that have been revealed by systematic studies of genes with respect to location in the interactome
Figure 3
Figure 3
Conceptual framework of edgetics. Location of variants within a protein has implications for their phenotypic consequences. Variants that map to the core of the protein are more likely to destabilize it, resulting in a loss of all interactions in which the protein participates. In contrast, mutations at protein interaction interfaces are more likely to perturb specific interactions. Variants mapping to the protein surfaces outside of binding interfaces are less likely to create a phenotype than core or interface variants
Figure 4
Figure 4
Mapping amino acid position to potential to interfere with protein interactions. Protein structures of FGF2 and FGFR1 are shown on the left and right respectively, and as a complex in the center (protein data Bank structure ID: 1CVS). In the complex, residues are colored according to location in the protein core (purple and green), at the interface (pink and blue) or at the surface outside of the interface (transparent pink and blue) on the two proteins respectively
Figure 5
Figure 5
Modeling the edgetic effects of genetic variants supports exploration of disease mechanisms. (a) Pleiotropy can result when different variants in the same gene affect different interactions in which a protein participates. (b) Variants at reciprocal interfaces of interacting proteins can contribute to locus heterogeneity
Figure 6
Figure 6
Propagating variant effects on networks. Variants can be used as signal sources for network propagation in order to identify network neighborhoods affected by variants. Edgetic effects can be used to constrain network propagation according to the effects of variants on specific protein interactions. On the left side of this schematic, two variants to the purple node affect interactions with different subsets of partners (indicated by blue and pink nodes respectively). Network propagation can be used to implicate network regions likely to be affected by each variant, and these can be contrasted to identify regions perturbed by both variants that could explain shared phenotypes (right network, circled purple shaded nodes), or regions affected specifically by each variant (right network, blue and pink shaded regions) which could help explain pleiotropic effects

References

FURTHER READING

    1. Bartocci, E. , & Lió, P. (2016). Computational modeling, formal analysis, and tools for systems biology. PLoS Computational Biology, 12(1), e1004591 10.1371/journal.pcbi.1004591 - DOI - PMC - PubMed
    1. Cho, D. Y. , Kim, Y. A. , & Przytycka, T. M. (2012). Chapter 5: Network biology approach to complex diseases. PLoS Computational Biology, 8(12), e1002820 10.1371/journal.pcbi.1002820 - DOI - PMC - PubMed
    1. Koller, D. , & Friedman, N. (2009). Probabilistic graphical models: Principles and techniques. Cambridge, MA: MIT Press.
    1. Mezlini, A. M. , & Goldenberg, A. (2017). Incorporating networks in a probabilistic graphical model to find drivers for complex human diseases. PLoS Computational Biology, 13(10), e1005580 10.1371/journal.pcbi.1005580 - DOI - PMC - PubMed

References

    1. Abar, S. , Theodoropoulos, G. K. , Lemarinier, P. , & O'Hare, G. M. P. (2017). Agent based modelling and simulation tools: A review of the state‐of‐art software. Computer Science Review, 24, 13–33.
    1. Abecasis, G. R. , Altshuler, D. , Auton, A. , Brooks, L. D. , Durbin, R. M. , Gibbs, R. A. , … Consortium, G. P. (2010). A map of human genome variation from population‐scale sequencing. Nature, 467, 1061–1073. - PMC - PubMed
    1. Abecasis, G. R. , Auton, A. , Brooks, L. D. , DePristo, M. A. , Durbin, R. M. , Handsaker, R. E. , … Consortium, G. P. (2012). An integrated map of genetic variation from 1,092 human genomes. Nature, 491, 56–65. - PMC - PubMed
    1. Albert, R. (2005). Scale‐free networks in cell biology. Journal of Cell Science, 118, 4947–4957. - PubMed
    1. Albert, R. , Jeong, H. , & Barabasi, A. L. (2000). Error and attack tolerance of complex networks. Nature, 406, 378–382. - PubMed

Publication types