Review
. 2018 Dec 13;9(1):1-58.
doi: 10.1002/cphy.c170040.

Contribution of Adipose Tissue Inflammation to the Development of Type 2 Diabetes Mellitus

Affiliations
Review

Contribution of Adipose Tissue Inflammation to the Development of Type 2 Diabetes Mellitus

Maggie S Burhans et al. Compr Physiol. .

Abstract

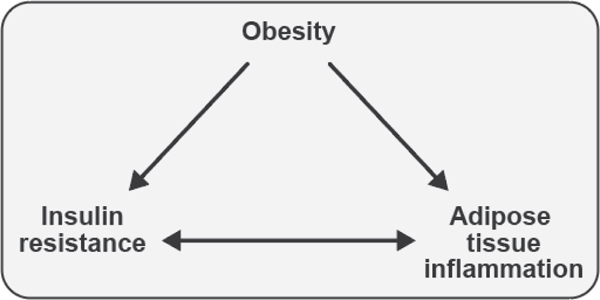
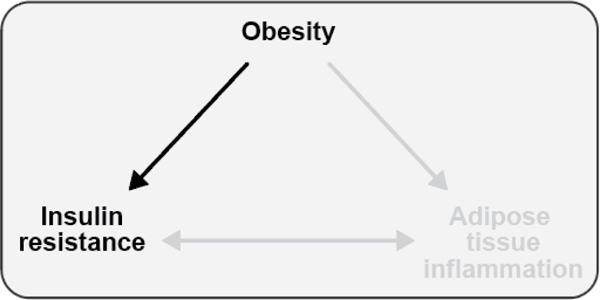
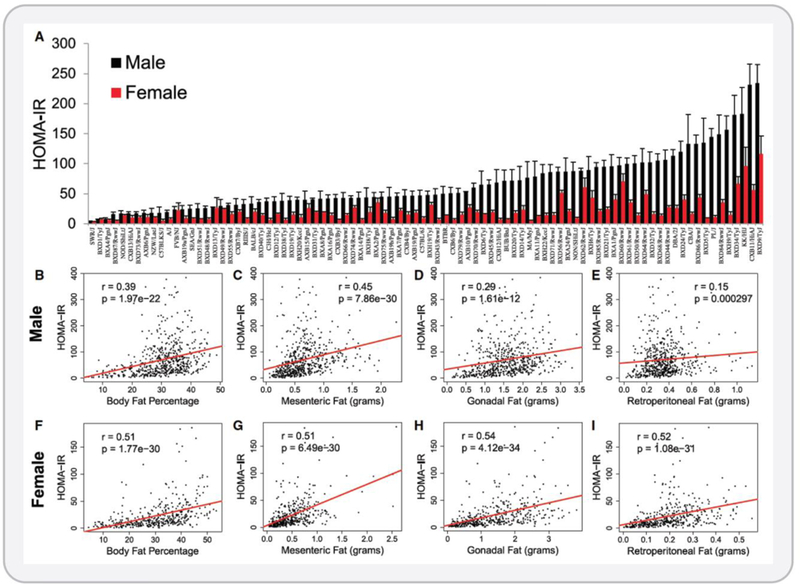
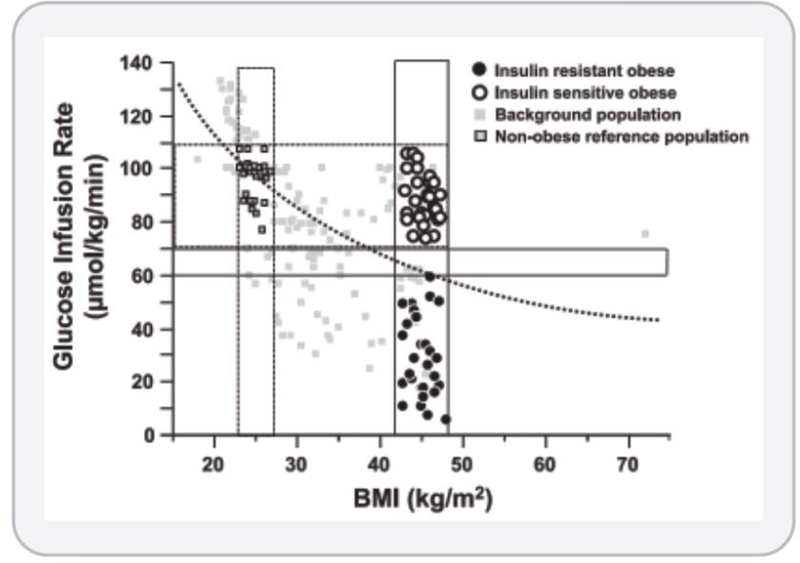
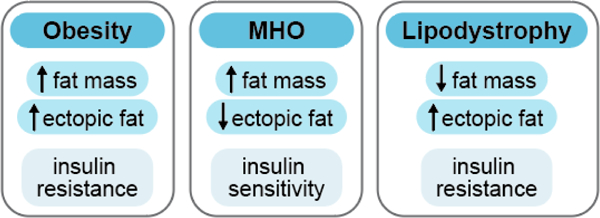
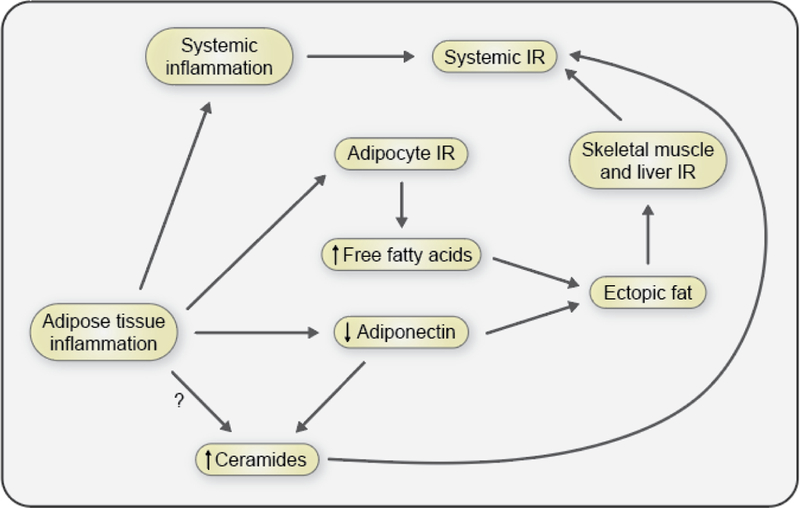
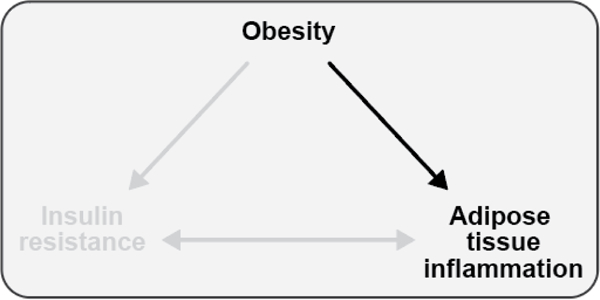
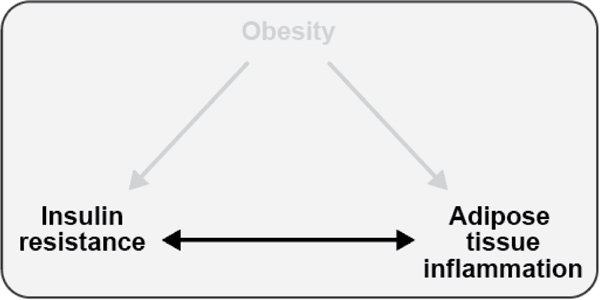
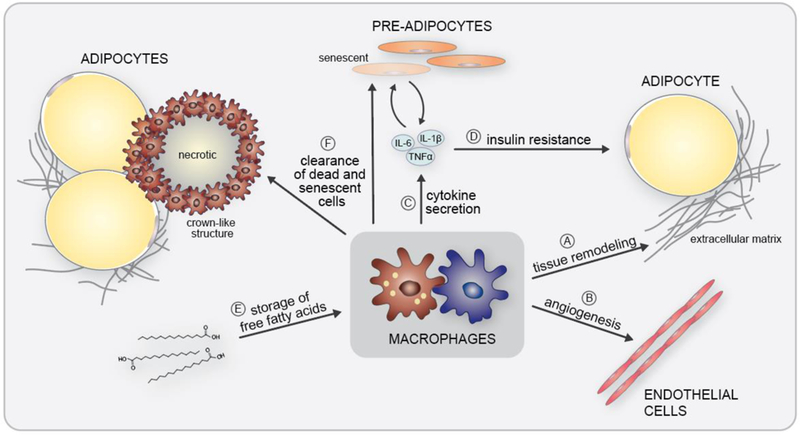
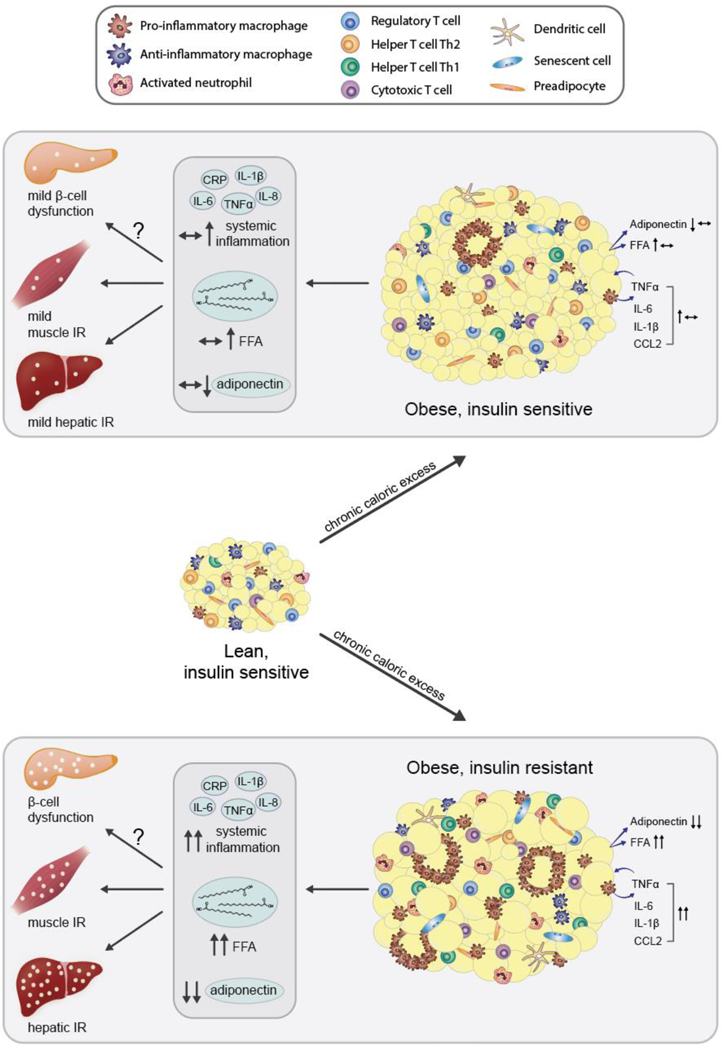
The objective of this comprehensive review is to summarize and discuss the available evidence of how adipose tissue inflammation affects insulin sensitivity and glucose tolerance. Low-grade, chronic adipose tissue inflammation is characterized by infiltration of macrophages and other immune cell populations into adipose tissue, and a shift toward more proinflammatory subtypes of leukocytes. The infiltration of proinflammatory cells in adipose tissue is associated with an increased production of key chemokines such as C-C motif chemokine ligand 2, proinflammatory cytokines including tumor necrosis factor α and interleukins 1β and 6 as well as reduced expression of the key insulin-sensitizing adipokine, adiponectin. In both rodent models and humans, adipose tissue inflammation is consistently associated with excess fat mass and insulin resistance. In humans, associations with insulin resistance are stronger and more consistent for inflammation in visceral as opposed to subcutaneous fat. Further, genetic alterations in mouse models of obesity that reduce adipose tissue inflammation are-almost without exception-associated with improved insulin sensitivity. However, a dissociation between adipose tissue inflammation and insulin resistance can be observed in very few rodent models of obesity as well as in humans following bariatric surgery- or low-calorie-diet-induced weight loss, illustrating that the etiology of insulin resistance is multifactorial. Taken together, adipose tissue inflammation is a key factor in the development of insulin resistance and type 2 diabetes in obesity, along with other factors that likely include inflammation and fat accumulation in other metabolically active tissues. © 2019 American Physiological Society. Compr Physiol 9:1-58, 2019.


Figures

Figure 1.
Figure 1.. Associations between obesity, insulin resistance, and adipose tissue inflammation.
Obesity is associated with both insulin resistance and adipose tissue inflammation in humans and rodent models. Adipose tissue inflammation and insulin resistance are also associated, but the direction of causality is controversial. This review will explore each of these relationships, highlighting evidence generated from studies conducted in both humans and rodents. Teaching points: Obesity is associated with both insulin resistance and adipose tissue inflammation in humans and animal models. Adipose tissue inflammation and insulin resistance are also associated, but the direction of causality is controversial.
Figure 2.
Figure 2.. Causes of and health risks associated with obesity.
Several factors contribute to the development of obesity; these factors may have an environmental, biological, or genetic basis. Obesity subsequently increases the risk for the development of many diseases and disorders, including CVD, T2DM, and cancer, three of the top ten killers of adults in the United States. Abbreviations: SES, socioeconomic status; PCOS, polycystic ovary syndrome; CVD, cardiovascular disease; T2DM, type 2 diabetes mellitus; NAFLD, nonalcoholic fatty liver disease; GERD, gastroesophageal reflux disease. Teaching points: The development of obesity is complex and many factors are known to contribute to it; these factors may have an environmental, biological, or genetic basis. Obesity increases the risk for the development of many other diseases and disorders, including CVD, T2DM, and cancer, three of the top ten killers of adults in the United States. SES, socioeconomic status; PCOS, polycystic ovary syndrome; CVD, cardiovascular disease; T2DM, type 2 diabetes mellitus; NAFLD, nonalcoholic fatty liver disease; GERD, gastroesophageal reflux disease.
Figure 3.
Figure 3.. Insulin sensitivity, pancreatic β-cell function, and glucose effectiveness in the regulation of glucose homeostasis
Glucose tolerance, i.e. the body’s ability to maintain glucose within a relatively narrow homeostatic range, is regulated by three key factors: insulin sensitivity, pancreatic β-cell function, and glucose effectiveness (A) (38, 215, 420). Insulin sensitivity is the responsiveness of liver and extrahepatic tissues, such as skeletal muscle and adipose tissue, to insulin (215). There are a number of physiological and pathophysiological mechanisms that affect insulin sensitivity, as we will discuss throughout this paper. In healthy, glucose tolerant individuals, as insulin sensitivity declines, the pancreatic β-cell will compensate by producing more insulin (B) (217). Only when the β-cell is unable to fully compensate for a given degree of insulin resistance will glucose intolerance ensue (217). This phenomenon, commonly called β-cell dysfunction, is a critical component of glucose homeostasis (217). In fact, in healthy, glucose tolerant individuals, the product of insulin sensitivity and pancreatic β-cell function, the disposition index, is constant as insulin sensitivity changes due to physiologic or pathophysiologic events (217). Put more simply, highly insulin sensitive individuals release little insulin in response to glucose stimulation, simply because more is not needed and would, in fact, be harmful, while less insulin sensitive individuals secrete more insulin to maintain normal glucose homeostasis. It is only when insulin production and secretion cannot fully compensate for insulin resistance that the disposition index declines and glucose intolerance and eventually T2DM ensues (217). The third key factor contributing to glucose homeostasis is glucose effectiveness, the ability of glucose to drive its own disposal and inhibit endogenous gluconeogenesis, in a manner independent of insulin (38, 420). Even though glucose effectiveness clearly exhibits substantial inter-individual variability (420), and reduced glucose effectiveness is as much a risk factor for T2DM as reduced insulin sensitivity (291), little is known about factors affecting glucose effectiveness. Glucose effectiveness is therefore often overlooked in studies of glucose homeostasis (101). Figure 3b reproduced from Kahn et al. (216), with permission. Teaching points: Glucose tolerance is the body’s ability to maintain glucose within a relatively narrow homeostatic range and is regulated by three key factors: insulin sensitivity, pancreatic β-cell function, and glucose effectiveness (A) (38, 215, 420). Insulin sensitivity is the responsiveness of target cells to insulin signaling (215). In healthy, glucose tolerant individuals, a decline in insulin sensitivity is compensated for by an increase in insulin production and secretion (shown in green, normal glucose tolerance) (B) (217). Only when the pancreatic β-cells are unable to fully compensate for a decline in insulin sensitivity will glucose intolerance (shown in yellow, impaired glucose tolerance) and eventually T2DM (shown in red) ensue (217). Figure 3b reproduced from Kahn et al. (216), with permission.
Figure 4.
Figure 4.. Obesity is associated with the development of insulin resistance.
The association between excess adiposity and insulin resistance is well established; however, there are exceptions to the relationship wherein obese individuals may be insulin sensitive and individuals with a deficit of adipose tissue, as in lipodystrophy, may be severely insulin resistant. Teaching points: The association between excess adiposity and insulin resistance is well established in humans and animal models. However, there are known exceptions to this relationship wherein some obese individuals may be insulin sensitive while some individuals with a deficit of adipose tissue, as in lipodystrophy, may be severely insulin resistant.
Figure 5.
Figure 5.. Variation in adiposity and insulin resistance among inbred strains of mice.
Males and females of more than 100 inbred strains of mice were fed a high-sucrose high-fat diet for eight weeks. Adiposity and systemic insulin resistance were highly variable in response to this diet. (A) HOMA-IR was determined in males and females. HOMA-IR was correlated with total body fat percentage (B and F) and with mesenteric (C and G), gonadal (D and H), and retroperitoneal (E and I) adipose depots of both male (B – E) and female (F – I) mice. The substantial variability in insulin resistance at any given level of adiposity can be appreciated in panels B – I. These data reveal that there is substantial genetic control over these metabolic phenotypes and that total adiposity may not be the primary factor driving insulin resistance. Reproduced from Parks et al. (371), with permission. Teaching points: This large-scale animal study very clearly showed that genetic variation has a major impact on both adiposity and insulin sensitivity in response to a high calorie diet. In this study, over 100 inbred mouse strains were fed a high-sugar high-fat diet for eight weeks and fat mass, percent body fat, and insulin resistance were measured. This study design allowed the authors to assess the effect of genetics on these metabolic phenotypes. The substantial variability in adiposity and insulin sensitivity across the different mouse strains in response to the high-sugar high-fat diet is evident and indicates that genetic variation exerts significant control over these phenotypes. These results also support the idea that total adiposity may not be the primary factor driving the development of insulin resistance. Reproduced from Parks et al. (371), with permission.
Figure 6.
Figure 6.. Insulin sensitivity and adiposity are negatively associated in humans.
Insulin sensitivity was determined by glucose infusion rate from euglycemic-hyperinsulinemic clamps and plotted against adiposity as estimated by BMI. These data highlight the variability in insulin sensitivity at any given BMI. Although an inverse association between BMI and insulin sensitivity generally applies on a population level, however there is large variability in insulin sensitivity at any given BMI, particularly at among the overweight and obese BMI categories (>25 kg/m2). Of note, there are obese individuals who maintain a level of insulin sensitivity equivalent to those with BMI around 25 kg/m2. These individuals may be referred to as ‘metabolically healthy obese (MHO)’ and comprise approximately 10–30% of the obese population. These individuals remain free from the metabolic syndrome and glucose intolerance that would be expected based on their BMI. Reproduced from Kloeting et al. (238). Teaching points: In this study, the authors used the euglycemic hyperinsulinemic clamp procedure to measure the glucose infusion rate (y-axis) needed to maintain glucose concentrations in plasma constant under high insulin concentrations, which is the gold-standard method for the determination of insulin sensitivity. A high glucose infusion rate is indicative of high insulin sensitivity. In non-obese to obese individuals (body mass index, BMI, on the x-axis), they found that adiposity and insulin sensitivity are negatively correlated. In addition, this study also highlights the variability in insulin sensitivity that exists at any given BMI, indicating that total fat mass is not the only determinant of insulin sensitivity. Indeed, there are obese individuals who maintain a level of insulin sensitivity equivalent to those with a non-obese BMI. These individuals may be referred to as ‘metabolically healthy obese (MHO)’ and are estimated to comprise approximately 10–30% of the obese population. These individuals do not develop metabolic syndrome, insulin resistance, and impaired glucose tolerance that would be expected based on their BMI. Figure reproduced with permission (Reproduced from Kloeting et al. (238).
Figure 7.
Figure 7.. Type 2 diabetes is an aging-associated disease.
The prevalence of diabetes increases with age, and is substantially increased in the 65 and older population as compared to the 45 – 64 year old population (65). Teaching points: The prevalence of diabetes increases with age and is nearly doubled in the 65 and older population as compared to the 45 – 64 year old population (65). Aging is also associated with insulin resistance that may be largely explained by a shift in adiposity from subcutaneous to visceral depots and an increase in ectopic fat accumulation.
Figure 8.
Figure 8.. Metabolic characterization of obesity, metabolically healthy obesity (MHO), and lipodystrophy.
Metabolically functional, healthy adipose tissue may be a key determinant of overall metabolic health. Although all obese individuals are characterized by excess adiposity, not all obese individuals develop metabolic dysfunction. An estimated 10 – 30% of the obese population may be metabolically healthy and exhibit reduced ectopic fat accumulation and are more insulin sensitive compared to metabolically unhealthy obese individuals (44, 45). Lipodystrophy is characterized by reduced adiposity but is accompanied by metabolic dysfunction including ectopic fat deposition and severe insulin resistance (140). The metabolic differences among obese, MHO, and lipodystrophic populations reveal that total adiposity is not likely the major determinant of metabolic health but rather that metabolically functional adipose tissue that maintains insulin sensitivity is a major contributor to whole-body metabolic health. Teaching points: The study of obesity, metabolically healthy obesity (MHO), and lipodystrophy reveals that healthy, functional adipose tissue may be a key determinant of overall metabolic health. Although all obese individuals are characterized by excess fat tissue, not all obese individuals develop metabolic dysfunction such as insulin resistance. A small proportion of the obese population maintains a state of metabolic health in which they remain more insulin sensitive as compared to metabolically unhealthy obese individuals (44, 45). Lipodystrophy, on the other hand, is characterized by a reduced amount of adipose tissue, but is usually accompanied by ectopic fat deposition and severe insulin resistance (140). These examples strongly suggest that total adiposity is not likely the primary determinant of metabolic health.
Figure 9.
Figure 9.. Adipose tissue inflammation may be a driving factor in the development of systemic insulin resistance (IR).
Chronic, low-grade adipose tissue inflammation is associated with the development of systemic IR in obesity. There are several mechanisms through which adipose tissue inflammation may contribute to IR: a) the secretion of cytokines by obese adipose tissue directly contributes to systemic inflammation which is associated with IR; b) adipose tissue-derived cytokines also impair local adipocyte insulin sensitivity which leads to increased lipolysis and secretion of free fatty acids; c) inflamed adipose tissue is also associated with reduced secretion of the insulin-sensitizing adipokine adiponectin. Adiponectin receptors contain intrinsic ceramidase activity, and reduced adiponectin as well as increased pro-inflammatory cytokine signaling may lead to increased levels of ceramides which are associated with adipose tissue inflammation and insulin resistance; d) elevated circulating free fatty acids and reduced adiponectin are associated with increased ectopic fat deposition. Hepatic and skeletal muscle fat accumulation are associated with impaired insulin signaling and systemic IR. Teaching points: Chronic, low-grade adipose tissue inflammation is associated with the development of systemic IR in obesity. There are several potential mechanisms through which adipose tissue inflammation may contribute to the development of IR, including an increase in the production and secretion of pro-inflammatory cytokines that directly contributes to systemic inflammation and impairs adipocyte insulin sensitivity. IR at the level of the adipocyte results in increased lipolysis and secretion of free fatty acids. Adipose tissue inflammation is also associated with reduced secretion of the insulin-sensitizing adipokine adiponectin. Reduced adiponectin and increased pro-inflammatory cytokine signaling may lead to increased levels of ceramides which are also associated with adipose tissue inflammation and insulin resistance. Many of these mechanisms also contribute to the development of ectopic fat accumulation, in organs such as the liver and skeletal muscle, which is also strongly associated with systemic IR.
Figure 10.
Figure 10.. Obesity is associated with adipose tissue inflammation.
The development of chronic, low-grade adipose tissue inflammation is common in obesity. Teaching points: The development of chronic, low-grade adipose tissue inflammation is common in obesity.
Figure 11.
Figure 11.. Insulin resistance and adipose tissue inflammation are strongly associated.
Although insulin resistance and adipose tissue inflammation generally characterize obese adipose tissue, the direction of causality has not been conclusively determined. Teaching points: Although insulin resistance and adipose tissue inflammation generally characterize obese adipose tissue, the direction of causality has not been conclusively determined.
Figure 12.
Figure 12.. Key functions of macrophages in adipose tissue physiology.
Leukocytes infiltrating adipose tissue, particularly macrophages, play key roles in processes that allow growth of adipose tissue in the context of chronic caloric excess. These include the breakdown of extracellular matrix proteins as cells expand and to create room for new adipocytes, and laying down new extracellular matrix, processes that are collectively known as ‘tissue remodeling’ (A). Macrophages also play a critical role in the formation of new blood vessels as the tissue expands, i.e., angiogenesis (B). The activation of inflammatory pathways in adipocytes and immune cells (C) also may play an important physiological role, because the induction of insulin resistance in adipocytes (D) may serve to limit excessive hypertrophy of these cells, which is known to trigger cell death. Macrophages are also able to intermittently store lipid (E), which could become important whenever the lipid-storage capacity of adipocytes is (temporarily) restricted. And lastly, macrophages play a key role in the removal of cellular debris from necrotic or apoptotic adipocytes or senescent cells (F). Teaching points: Although obesity is associated with the development of chronic, low-grade adipose tissue inflammation, the immune cells that infiltrate the adipose tissue perform several different functions that allow for healthy expansion of adipose tissue during chronic caloric excess. Examples of functions of macrophages in adipose tissue include the breakdown of extracellular matrix proteins as cells expand and to create room for new adipocytes, and laying down new extracellular matrix, processes that are collectively known as ‘tissue remodeling’ (A). Macrophages also play a critical role in the formation of new blood vessels as the tissue expands, i.e., angiogenesis (B). The activation of inflammatory pathways in adipocytes and immune cells (C) also may play an important physiological role because the induction of insulin resistance in adipocytes (D) may serve to limit excessive hypertrophy of these cells, which is known to trigger cell death. Macrophages are also able to intermittently store lipid (E), which could become important whenever the lipid-storage capacity of adipocytes is (temporarily) restricted. And lastly, macrophages play a key role in the removal of cellular debris from necrotic or apoptotic adipocytes or senescent cells (F).
Figure 13.
Figure 13.. Adipose tissue inflammation, ectopic fat deposition, and insulin resistance in obesity.
In the context of chronic caloric excess, adipose tissue is challenged to store excess calories in the form of TG. This requires either the differentiation of preadipocytes to mature adipocytes (hyperplasia) or hypertrophy of existing adipocytes. Currently available evidence suggests that the ability of adipose tissue, particularly subcutaneous adipose tissue, to expand in a healthy fashion is reliant primarily upon hyperplasia, which prevents excessive adipocyte hypertrophy. This is one key differentiating factor between obese individuals that remain relatively insulin sensitive (upper panel) from those that become insulin resistant (lower panel). Larger adipocytes are more susceptible to cell death and are more strongly associated with immune cell infiltration and activation of pro-inflammatory pathways within adipocytes and infiltrating leukocytes. Together these processes promote insulin resistance within the expanded adipose tissue. Inflammation and insulin resistance in adipose tissue are major contributors to low-grade chronic systemic inflammation, hypoadiponectinemia, and an elevated flux of free fatty acids (FFA) to the liver, muscle, and pancreas, eventually contributing to excessive ectopic fat storage in these organs. Elevated concentrations of TG in liver and muscle are considered a major contributor to insulin resistance in these organs, and TG stored in the pancreas may contribute to pancreatic β-cell dysfunction, i.e., the inability of the β-cell to fully compensate for insulin resistance. The importance of adipose tissue inflammation in driving systemic insulin resistance relative to the other, interlinked factors outlined here is currently unclear, particularly in humans. Teaching points: During chronic caloric excess, a major challenge for adipose tissue is to store the excess calories as triglycerides. This requires the adipose tissue to expand, either by increasing the number of adipocytes (hyperplasia) or by increasing the size of existing adipocytes (hypertrophy). Currently available evidence suggests that the ability of adipose tissue, particularly subcutaneous adipose tissue, to expand in a healthy fashion is reliant primarily upon hyperplasia. An increase in the number of functional lipid-storing adipocytes prevents excessive adipocyte hypertrophy. This is one key differentiating factor between obese individuals that remain relatively insulin sensitive (upper panel) from those that become insulin resistant (lower panel). Larger adipocytes are more susceptible to cell death and are more strongly associated with immune cell infiltration, activation of pro-inflammatory pathways, and a state of insulin resistance. Inflammation and insulin resistance in adipose tissue are major contributors to low-grade chronic systemic inflammation, low adiponectin concentrations in the circulation, and an elevated flux of adipose tissue-derived free fatty acids (FFA) to organs such as liver, muscle, and pancreas. Accumulation of triglycerides in liver and muscle are considered a major contributor to insulin resistance in these organs, and triglycerides stored in the pancreas may impair the inability of the β-cell to fully compensate for insulin resistance. The importance of adipose tissue inflammation in driving systemic insulin resistance relative to the other, interlinked factors outlined here is currently unclear, particularly in humans.

References

    1. Abate N, Garg A, Peshock RM, Stray-Gundersen J and Grundy SM. Relationships of generalized and regional adiposity to insulin sensitivity in men. J Clin Invest 96: 88–98, 1995. - PMC - PubMed
    1. Abate N, Sallam HS, Rizzo M, Nikolic D, Obradovic M, Bjelogrlic P and Isenovic ER. Resistin: an inflammatory cytokine. Role in cardiovascular diseases, diabetes and the metabolic syndrome. Curr Pharm Des 20: 4961–9, 2014. - PubMed
    1. Abdullah A, Peeters A, de Courten M and Stoelwinder J. The magnitude of association between overweight and obesity and the risk of diabetes: a meta-analysis of prospective cohort studies. Diabetes Res Clin Pract 89: 309–19, 2010. - PubMed
    1. Adams LA, Angulo P and Lindor KD. Nonalcoholic fatty liver disease. CMAJ 172: 899–905, 2005. - PMC - PubMed
    1. Adamson SE, Griffiths R, Moravec R, Senthivinayagam S, Montgomery G, Chen W, Han J, Sharma PR, Mullins GR, Gorski SA, Cooper JA, Kadl A, Enfield K, Braciale TJ, Harris TE and Leitinger N. Disabled homolog 2 controls macrophage phenotypic polarization and adipose tissue inflammation. J Clin Invest 126: 1311–22, 2016. - PMC - PubMed

Publication types