. 2019 Jul;17(7):1236-1247.
doi: 10.1111/pbi.13049. Epub 2019 Jan 19.

Impact of differential DNA methylation on transgene expression in cotton (Gossypium hirsutum L.) events generated by targeted sequence insertion

Affiliations

Impact of differential DNA methylation on transgene expression in cotton (Gossypium hirsutum L.) events generated by targeted sequence insertion

Aurine Verkest et al. Plant Biotechnol J. 2019 Jul.

Abstract

Targeted Genome Optimization (TGO) using site-specific nucleases to introduce a DNA double-strand break (DSB) at a specific target locus has broadened the options available to breeders for generation and combination of multiple traits. The use of targeted DNA cleavage in combination with homologous recombination (HR)-mediated repair, enabled the precise targeted insertion of additional trait genes (2mepsps, hppd, axmi115) at a pre-existing transgenic locus in cotton. Here we describe the expression and epigenome analyses of cotton Targeted Sequence Insertion (TSI) events over generations. In a subset of events, we observed variability in the level of transgene (hppd, axmi115) expression between independent but genetically identical TSI events. Transgene expression could also be differential within single events and variable over generations. This expression variability and silencing occurred independently of the transgene sequence and could be attributed to DNA methylation that was further linked to different DNA methylation mechanisms. The trigger(s) of transgene DNA methylation remains elusive but we hypothesize that targeted DSB induction and repair could be a potential trigger for DNA methylation.

Keywords: DNA methylation; DNA methylation mechanisms; cotton; differential silencing; epigenome analyses; expression variability; gene targeting; targeted sequence insertion; transgene expression; transgene silencing.


Figures

Figure 1
Figure 1
Targeted sequence insertion (TSI) events of different donor DNAs display variation in gene of interest (GOI) expression. (a) Sensitivity screening of embryogenic callus of glyphosate tolerant pCV211 events to the HPPD inhibitor herbicide tembotrione (TBT); TBTS , sensitive to TBT; TBTT , tolerant to TBT; GlyT, tolerant to glyphosate. (b) ELISA of HPPD protein expression in T0 plants, % HPPD of total protein is indicated (% TSP), n = number of plants analysed. (c) ELISA of AXMI115 protein expression in T0 plants, % AXMI115 of total protein is indicated (% TSP), n = number of plants analysed. (d). ELISA of AXMI115 and 2mEPSPS protein in a subset of T0 plants from Figure 1c. For each plant % 2mEPSPS (in red) and % AXMI115 (in blue; %TSP) is shown. pCV211, pCV244, pCV245, pCV252, pCV264, pCV265, pCV272 represent donor DNAs with a 2mepsps/hppd expression cassettes; pCV256, pCV257, pCV260, pCV261 represent donor DNAs with a 2mepsps/axmi115 expression cassettes. Details about the donor DNAs can be found in Table S1.
Figure 2
Figure 2
Gene of interest (GOI) expression is different between pCV211 sister plants and variable over generations. ELISA of HPPD protein expression over 5 generations (T1–T5) in TSI pCV211 G4GH9000‐023 event, sister plants G4GH9000‐023_2 (a) and G4GH900‐023_1 (b). Pie charts show the fraction of each expression class and the variation in expression over the generations. Green, ‘stable’ expressed; dark blue, ‘variable’ expressed; red, ‘variable’ silenced; pale blue, ‘reverted’ expressed. Plants analysed in each generation are indicated in Table S4. Donor DNA pCV211 contains a 2mepsps/hppd expression cassette (Table S1).
Figure 3
Figure 3
pCV260 axmi115 GOI expression is differential among events, sister plants and generations. ELISA of AXMI115 protein expression in event G4GH9029‐065 (a), and event G4GH9044‐025, sister plants G4GH9044‐02502_1 (b) and G4GH9044‐02502_2 (c) over 4‐to‐5 generations (T1 to T4‐T5). Pie charts show the fraction of each expression class and the variation in expression over the generations. Green, ‘stable’ expressed; dark blue, ‘variable’ expressed; red, ‘variable’ silenced; pale blue, ‘reverted’ expressed. Plants analysed in each generation are indicated in Table S4. Donor DNA pCV260 contains a 2mepsps/axmi expression cassette (Table S1).
Figure 4
Figure 4
pCV261 axmi115 GOI expression is differential among events and over generations. ELISA of AXMI115 protein expression in event G4GH9041‐166, sister plant G4GH9041‐166_2 (a) and event G4GH9057‐110, sister plant G4GH9057‐110_3 (b) over 4‐to‐5 generations (T1 to T4‐T5). Pie charts show the fraction of each expression class and the variation in expression over the generations. Green, ‘stable’ expressed; dark blue, ‘variable’ expressed; red, ‘variable’ silenced; pale blue, ‘reverted’ expressed; pink, ‘reverted’ silenced. Information on het number of plants analysed in each generation are indicated in Table S4. Donor DNA pCV261 contains a 2mepsps/axmi expression cassette (Table S1).
Figure 5
Figure 5
Variable GOI expression is associated with DNA methylation. Targeted bisulfite sequencing on progeny plants of stable expressing (green), variable expressing (blue) and silenced (red) plants. Plants originating from the events in Figures 2, 3 and 4 were analysed by targeted bisulfite sequencing (see Table S4). (a) pCV211 donor DNA, plants G4GH9000‐23_2 (green) and G4GH9000‐023_1 (blue and red). (b) pCV260 donor DNA, plants G4GH9029‐065_2 (green), G4GH9044‐025_1 (blue) and G4GH9044‐025_2 (red). (c) pCV261 donor DNA, plants G4GH9041‐166_2 (green) and G4GH9057‐110_3 (blue and red). Mean methylation density per cytosine in all contexts is plotted on a 0–100% scale. Analyses on additional samples is shown in Figure S2. pCV211 donor DNA contains a 2mepsps/hppd expression cassette; pCV260 and pCV261 represent donor DNA with a 2mepsps/axmi115 expression cassette (Table S1).
Figure 6
Figure 6
CG, CHG and CHH context methylation analysis. Context specific methylation rates within the GOI in (a) pCV211, (b) pCV260 and (c) pCV261 donor DNA TSI events were determined by bisulfite methylation sequencing. Mean methylation density per cytosine context is plotted to the GOI on a 0–100% or 0–50% scale. Green, ‘stable’ expressed; blue, ‘variable’ expressed; red, ‘variable’ silenced. Plants analysed were the same as shown in Figure 5 (see Table S4). pCV211 donor DNA contains a 2mepsps/hppd expression cassette; pCV260 and pCV261 represent donor DNA with a 2mepsps/axmi115 expression cassette (Table S1).
Figure 7
Figure 7
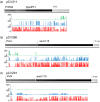
Variable transgene expressing TSI plants have different 24‐nt sRNA and histone mark GOI accumulation patterns. sRNA sequencing and ChIPqPCR on samples of stable expressing, variable expressing and silenced plants. Green, ‘stable’ expressed; dark blue, ‘variable’ expressed; red, ‘variable’ silenced; pale blue, ‘reverted’ expressed; pink, ‘reverted’ silenced. (a) pCV211 donor DNA, (b) pCV260 donor DNA and (c) pCV261 donor DNA TSI plants. Left, Mapping of the 24‐nt sRNA sequencing reads to the GOI sequences. The y axes are scaled the same per TSI/GOI. Reads were normalized per 10 million of genome‐matched (including the transgene sequence) 18‐to‐28 nucleotide sequences. Analyses on additional samples and accumulation of other sRNA size classes on the GOI (hppd/axmi) and complete TSI (hppd/axmi + epsps) sequence are shown in Figures [Link], [Link]–S6. Right, H3K9me2 and H3K4me3 ChIP. Enrichment was determined by qPCR and for each region normalized against the input. Analysed regions are indicated with a black line with digit 1 and 2 below it. Dots represent biological replicates. We indicate in Table S4 which plants have been analysed (ChIP column). Grey, background mock ChIP values.

References

    1. Ahmed, I. , Sarazin, A. , Bowler, C. , Colot, V. and Quesneville, H. (2011) Genome‐wide evidence for local DNA methylation spreading from small RNA‐targeted sequences in Arabidopsis . Nucleic Acids Res. 39, 6919–6931. - PMC - PubMed
    1. Ainley, W.M. , Sastry‐Dent, L. , Welter, M.E. , Murray, M.G. , Zeitler, B. , Amora, R. , Corbin, D.R. et al. (2013) Trait stacking via targeted genome editing. Plant Biotechnol. J. 11, 1126–1134. - PubMed
    1. Artico, S. , Nardeli, S.M. , Brilhante, O. , Grossi‐de‐Sa, M.F. and Alves‐Ferreira, M. (2010) Identification and evaluation of new reference genes in Gossypium hirsutum for accurate normalization of real‐time quantitative RT‐PCR data. BMC Plant Biol. 10, 49. - PMC - PubMed
    1. Begemann, M.B. , Gray, B.N. , January, E. , Gordon, G.C. , He, Y. , Liu, H. , Wu, X. et al. (2017) Precise insertion and guided editing of higher plant genomes using Cpf1 CRISPR nucleases. Sci. Rep. 7, 11606. - PMC - PubMed
    1. Bewick, A.J. , Ji, L. , Niederhuth, C.E. , Willing, E.‐M. , Hofmeister, B.T. , Shi, X. , Wang, L. et al. (2016) On the origin and evolutionary consequences of gene body DNA methylation. Proc. Natl Acad. Sci. 113, 9111–9116. - PMC - PubMed